
Image
|
Figure Caption
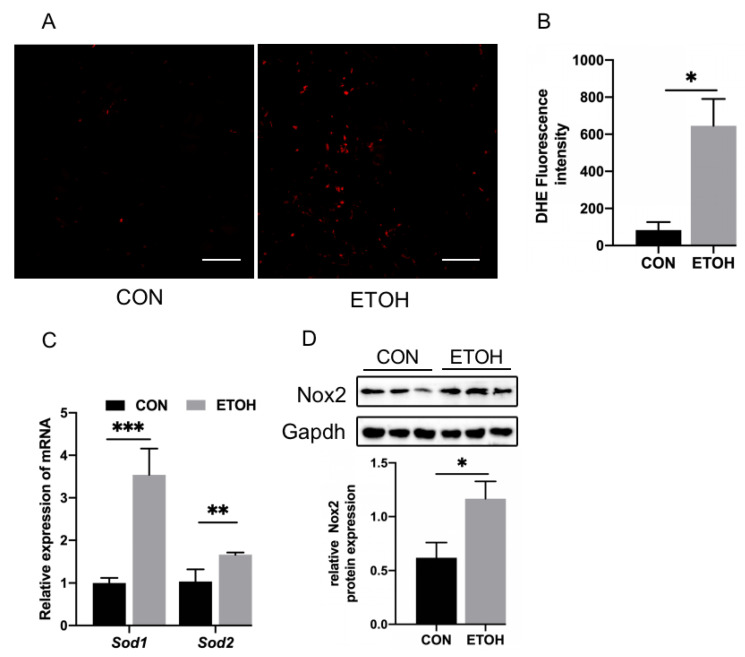
Fig. 3
Zebrafish skeletal muscle ROS, oxidation, and antioxidant levels. (A) DHE staining of zebrafish skeletal muscle. Bar = 20 µm. (B) Quantitation of DHE staining. (C) mRNA levels of sod1 and sod2. (D) Western blot analysis of Nox2 expression. * p < 0.05, ** p < 0.01, and *** p < 0.001.
Figure Data
Acknowledgments
This image is the copyrighted work of the attributed author or publisher, and
ZFIN has permission only to display this image to its users.
Additional permissions should be obtained from the applicable author or publisher of the image.
Full text @ Life (Basel)