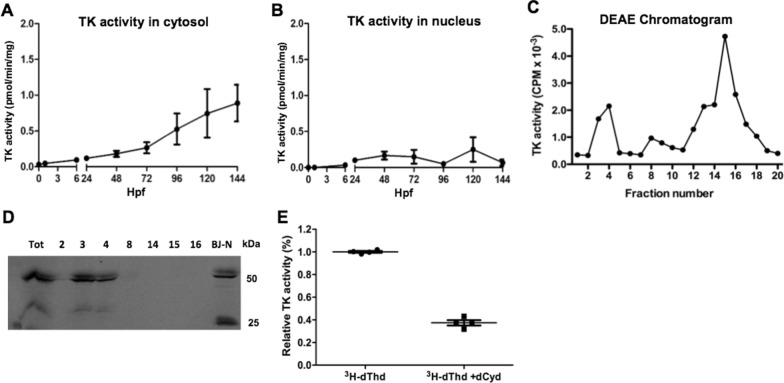
Fig. 4
Characterization of thymidine kinases. TK activity in the cytosol (A) and nucleus (B) fractions at different zebrafish developmental stages. C DEAE chromatography of cytosolic protein isolated from zebrafish at 120 hpf. Fractions were collected and TK activity was determined by using [3 H]-dThd as substrate. D Western blot analysis of the TK peak fractions (2, 3, 4, 8, 14,15 and 16) from DEAE chromatography using a TK1 specific antibody and only part of the image is shown. Cell extracts from a fibroblast (BJ-N) cell line was used as control. E Fractions from DEAE chromatography (fraction 15 and 16) were assayed in the absence and presence of excess dCyd using [3 H]-dThd as the substrate. Data was plotted as mean ± SD

