
Fig. 4
- ID
- ZDB-IMAGE-220622-95
- Genes
- Antibodies
- Publication
- Yang et al., 2022 - Myoneurin regulates BMP signaling by competing with Ppm1a for Smad binding
- All Figures
- Figures for Yang et al., 2022
|
Fig. 4
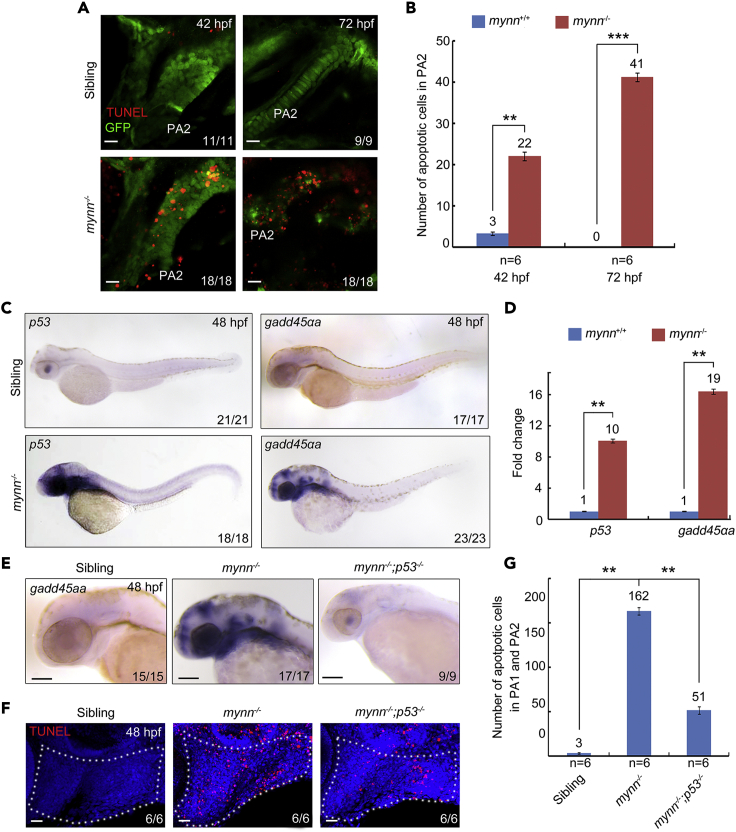
mynn mutants exhibit cell death and upregulated p53 signaling
(A and B) Detection of apoptotic cells in the pharyngeal regions. mynn-deficient Tg(fli1:EGFP) embryos and their siblings were collected at indicated stages for TUNEL assay (A). PA, pharyngeal arch. Scale bars, 10 μm. The number of TUNEL+ and GFP+ cells in PA2 was calculated from six embryos (B). Error bars indicate ±S.D. ∗∗, p < 0.01; ∗∗∗, p < 0.001 (by Student’s t-test).
(C) Expression pattern of p53 and gadd45αa in mynn−/− embryos at indicated stages.
(D) Real-time PCR analysis of the relative expression level of p53 and gadd45αa in wild-type and mynn−/− embryos. β-actin was used as an internal control. Embryos were pre-sorted as mentioned above. The data were presented as mean ± SD from three independent biological repeats. Total RNA of each group was extracted from a pool of 30 embryos. ∗∗, p < 0.01 (by Student’s t-test).
(E) Expression analysis of gadd45αa by in situ hybridization in mynn−/− mutants and mynn−/−;p53−/− embryos.
(F and G) The apoptotic cells in the pharyngeal region were clearly decreased in mynn−/−;p53−/− embryos. Indicated embryos were collected at 48 hpf, and then subjected to TUNNEL assays. Representative images were shown in (F). The white dotted lines outline the pharyngeal regions. Scale bars, 20 μm. The number of TUNEL-positive cells in the pharyngeal regions was showed in (G). Error bars indicate ±S.D. ∗∗, p < 0.01 (by Student’s t-test).