
Fig. 8
- ID
- ZDB-IMAGE-220622-26
- Genes
- Publication
- Liu et al., 2022 - Single-cell transcriptome reveals insights into the development and function of the zebrafish ovary
- All Figures
- Figures for Liu et al., 2022
|
Fig. 8
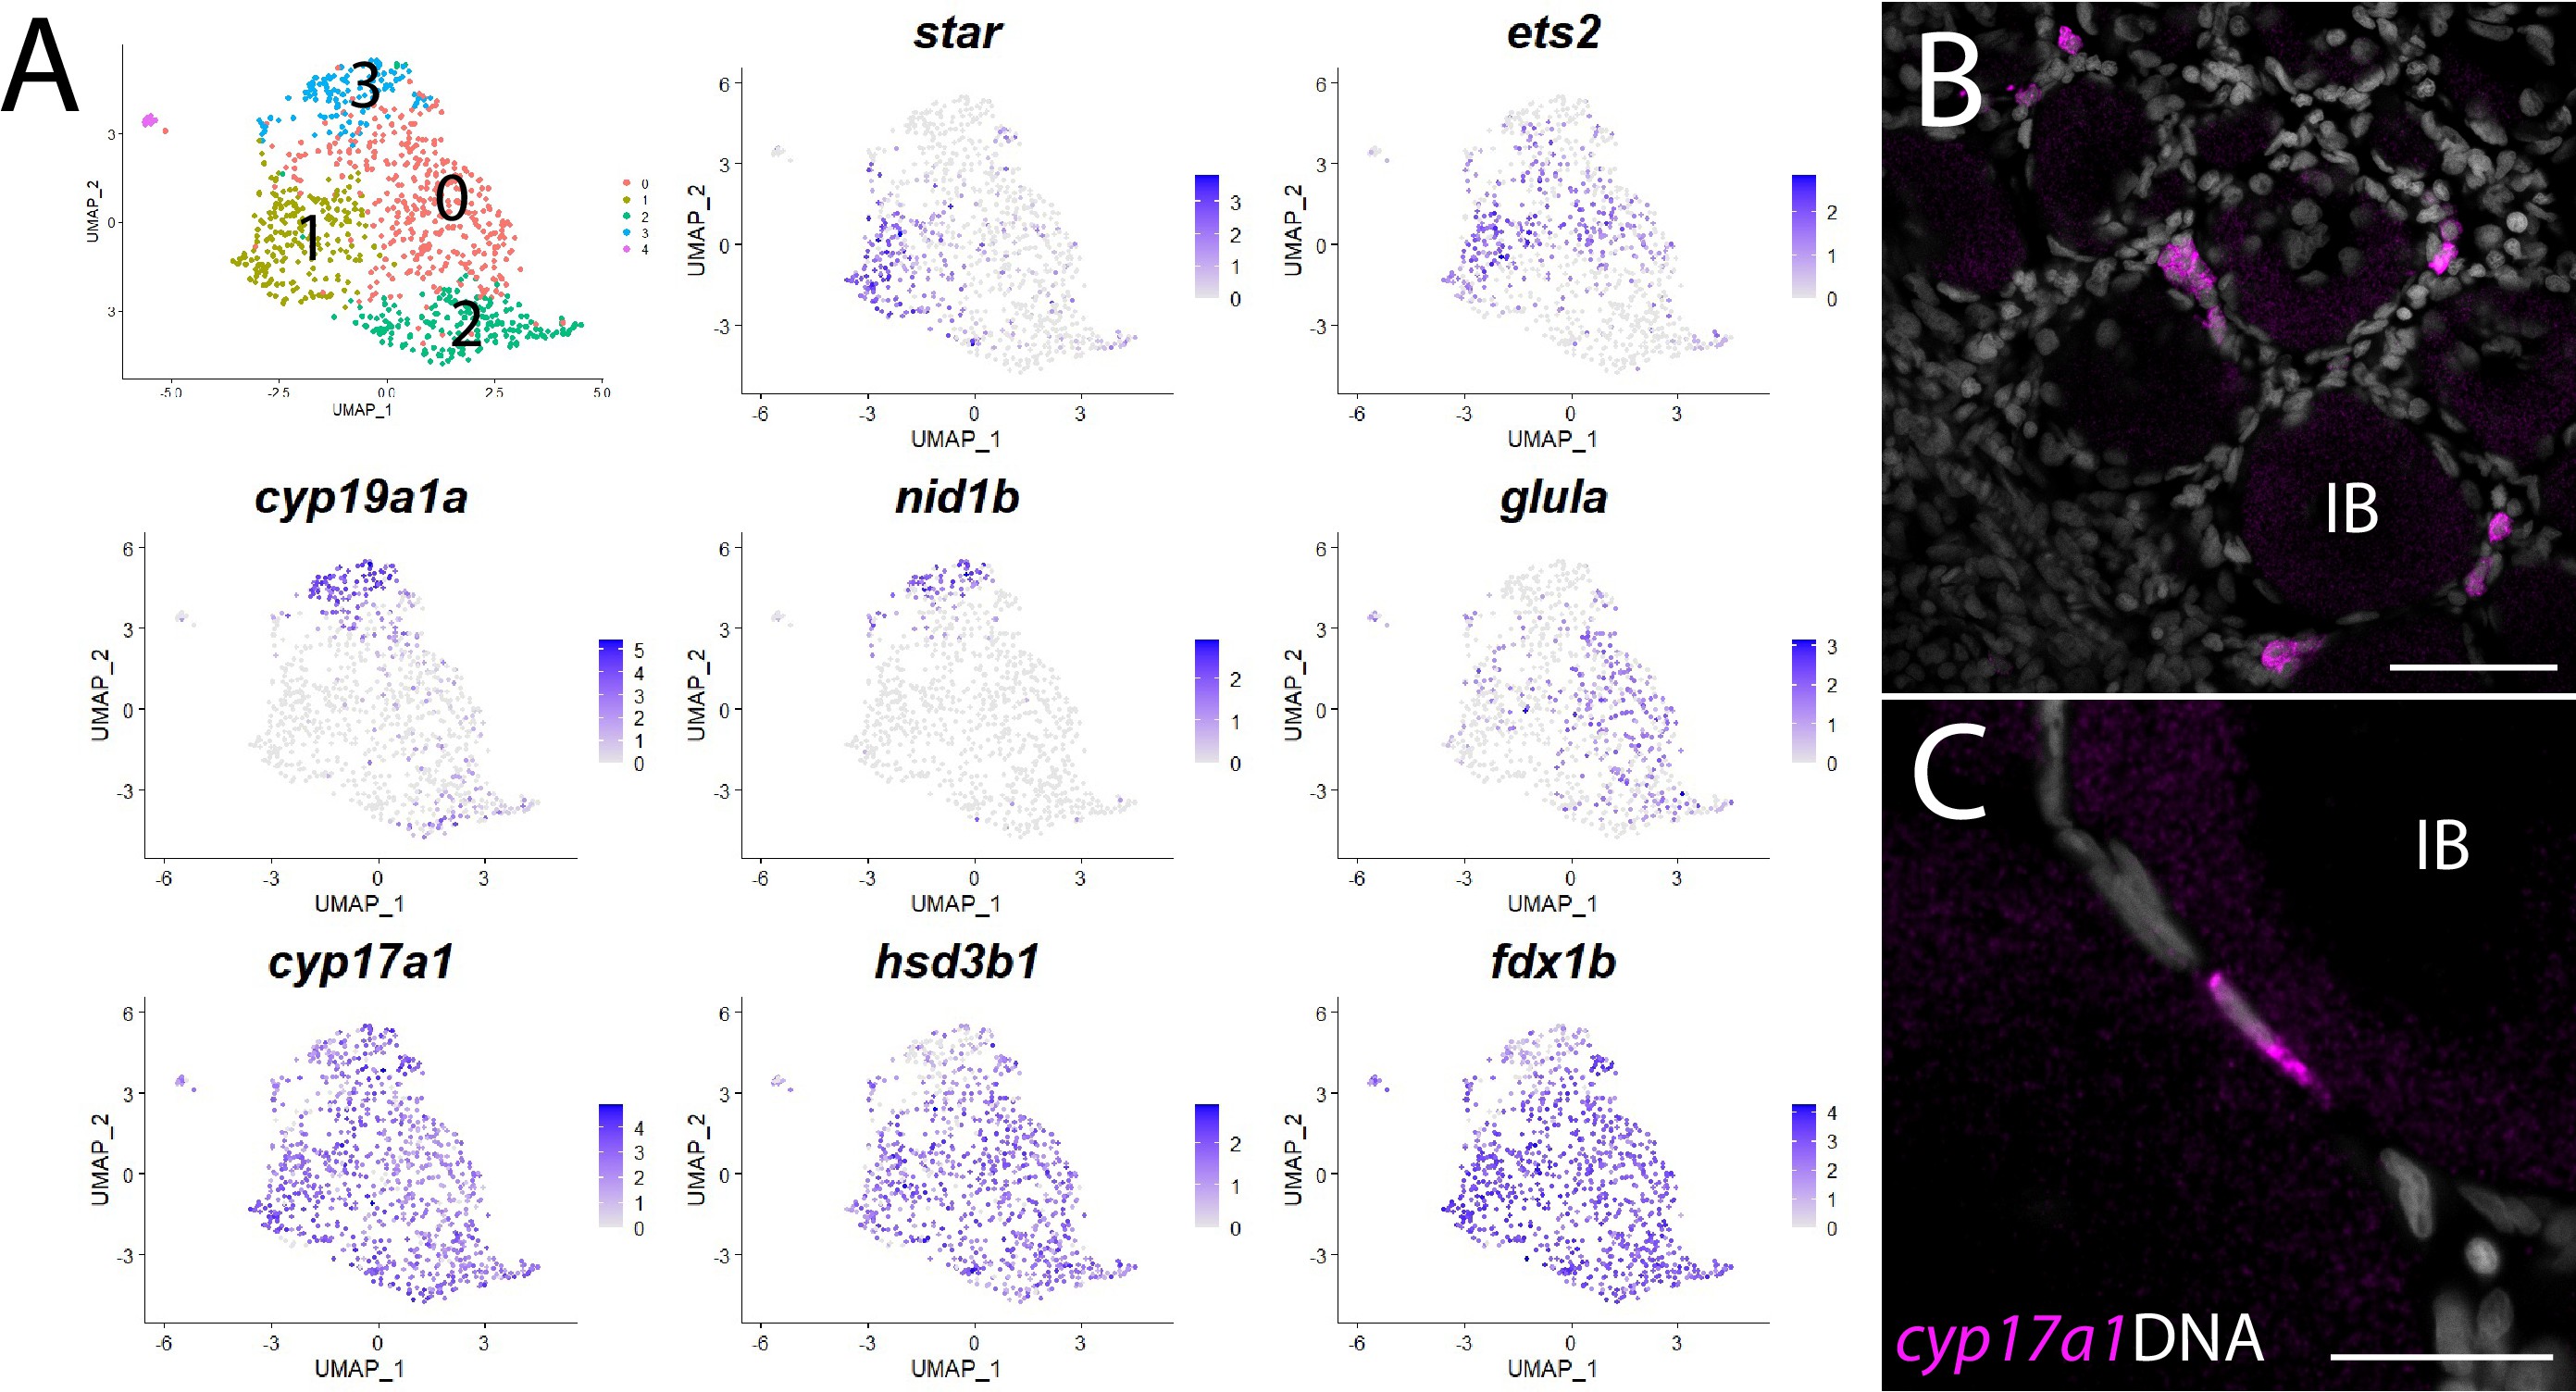
(A) Gene expression uniform manifold approximation and projection (UMAP) plots of select genes. Top-left panel shows cells color-coded by computationally determined cell subtype. Cells expressing the indicated gene are colored purple, and the relative intensity indicates relative expression levels (intensity scale for each plot is on the right). (B) Hybridization chain reaction RNA fluorescent in situ hybridization (HCR RNA-FISH) on whole-mount 40-day post-fertilization (dpf) ovaries reveals the location of cyp17a1-expressing theca cells. DNA is gray. (C) Higher magnification of cyp17a1-expressing theca cells. IB, stage IB oocyte. Scale bars in (B) 50 µm and (C) 20 µm.
Theca cell subcluster analysis.