
Fig. 1
- ID
- ZDB-IMAGE-220513-30
- Genes
- Publication
- Hortle et al., 2022 - OXSR1 inhibits inflammasome activation by limiting potassium efflux during mycobacterial infection
- All Figures
- Figures for Hortle et al., 2022
|
Fig. 1
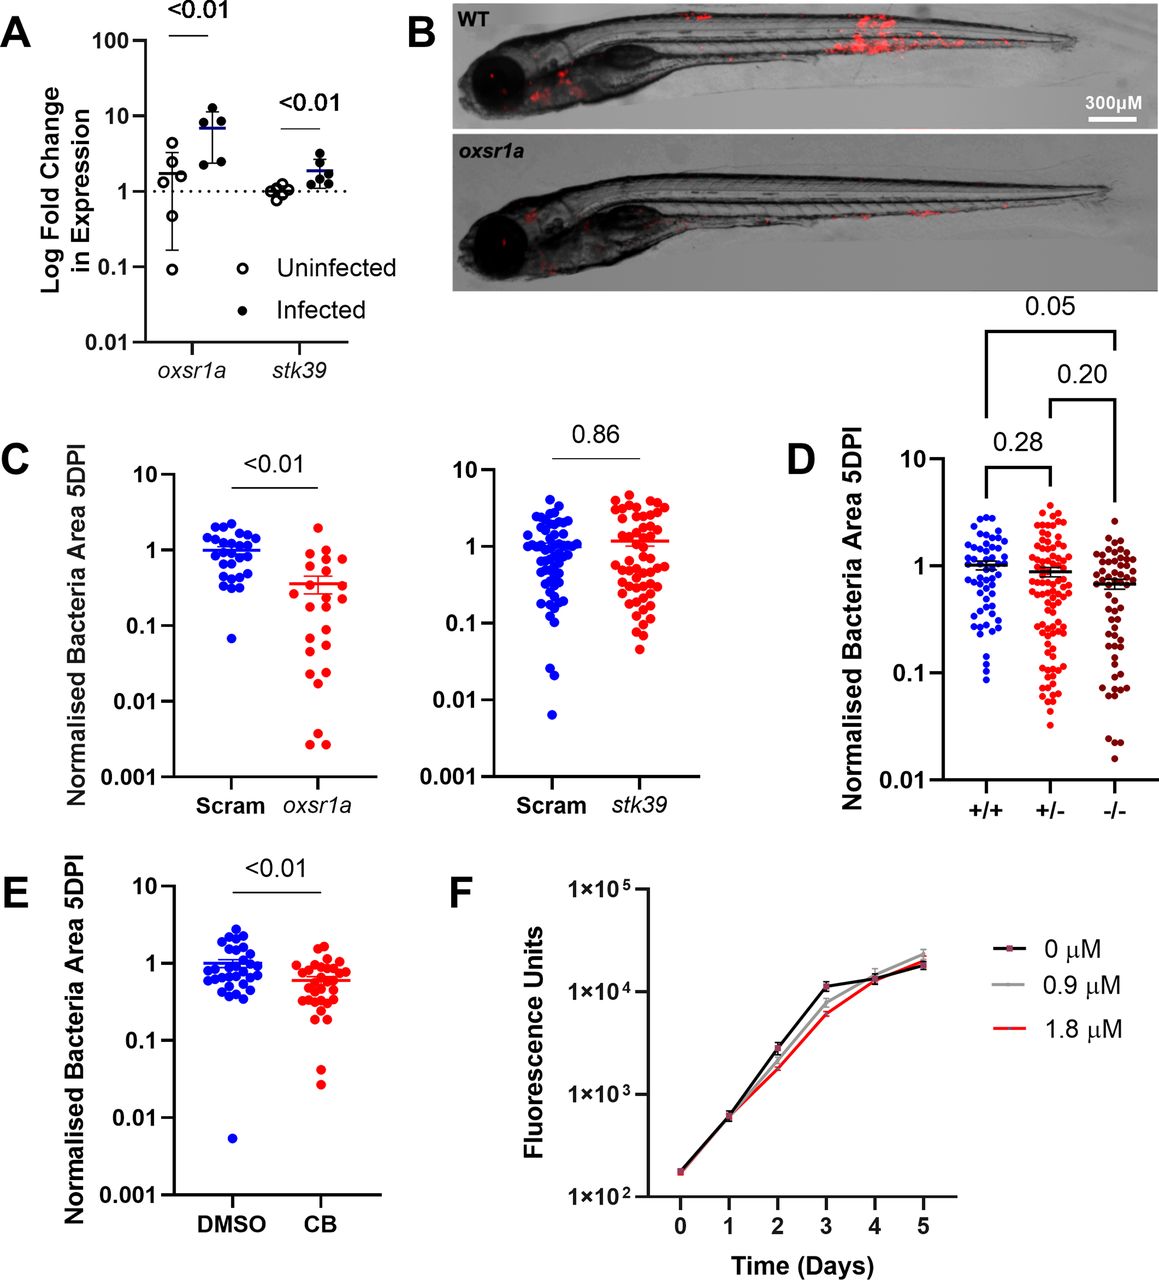
(A) Relative expression of oxsr1a and stk39 in zebrafish embryos at 3 dpi with WT M. marinum, compared with age-matched uninfected controls. Biological replicates (n = 6) each represent pooled RNA from 7 to 10 embryos. (B) Representative images of M. marinum–tdTomato (red) bacterial burden in WT and mosaic F0 oxsr1a crispant embryos. (C) Quantification of M. marinum bacterial burden in WT and mosaic F0 oxsr1a crispant embryos and F0 stk39 crispant embryos. Each graph shows combined results of two independent experiments. (D) Quantification of M. marinum bacterial burden in WT, heterozygous and homozygous oxsr1a knockout embryos. Graph shows combined results of two independent experiments. (E) Quantification of WT M. marinum bacterial burden in DMSO vehicle control and Compound B-treated embryos at 1.8 μM. (F) Quantification of axenic M. marinum–tdTomato growth by fluorescence in 7H9 broth culture supplemented with Compound B. Red line (1.8 μM) indicates the concentration used to treat infected embryos.