
IMAGE
Figure 3
- ID
- ZDB-IMAGE-220314-90
- Genes
- Publication
- Dinarello et al., 2022 - Zebrafish Mutant Lines Reveal the Interplay between nr3c1 and nr3c2 in the GC-Dependent Regulation of Gene Transcription
- All Figures
- Figures for Dinarello et al., 2022
Image
|
Figure Caption
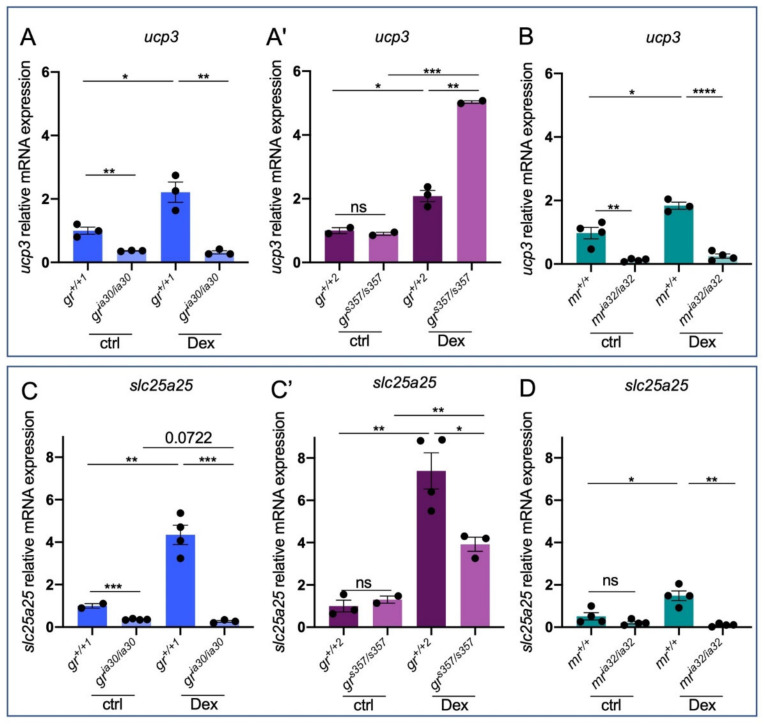
Figure 3
Figure 3. GC-dependent genes reveal different expression levels in the two nr3c1 zebrafish mutant lines. (A) RT-qPCR analysis of ucp3 in 6 dpf gr+/+1 and gria30/ia30 (A) and in gr+/+2 and grs357/s357 (A’) larvae with or without Dex treatment. (B) RT-qPCR analysis of ucp3 in 6 dpf mr+/+ and mria32/ia32 larvae with or without Dex treatment. (C) RT-qPCR analysis of slc25a25 in 6 dpf gr+/+1 and gria30/ia30 (C) and in gr+/+2 and grs357/s357 (C’) larvae with or without Dex treatment. (D) RT-qPCR analysis of slc25a25 in 6 dpf mr+/+ and mria32/ia32 larvae with or without Dex treatment. Statistical analyses were performed with Student’s t test. Mean ± SEM. * p < 0.05; ** p < 0.01; *** p < 0.001; **** p < 0.0001; ns = not significant.
Figure Data
Acknowledgments
This image is the copyrighted work of the attributed author or publisher, and
ZFIN has permission only to display this image to its users.
Additional permissions should be obtained from the applicable author or publisher of the image.
Full text @ Int. J. Mol. Sci.