
Figure 2
|
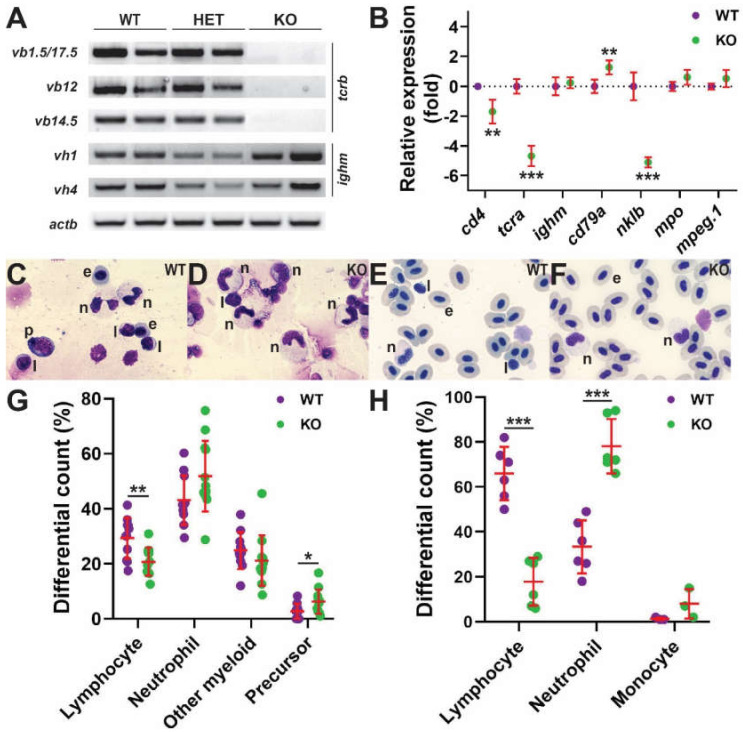
Figure 2
Effect of Il-2rγc.a ablation on later hematopoiesis. (A,B) Gene expression analysis. Larvae (28 dpf) obtained from in-crossing il2rgawt/mdu2 heterozygotes were harvested for gDNA and total RNA. The gDNA was used for the identification of wild-type (WT), heterozygote (HET), and homozygote knock-out (KO) siblings, and the RNA was subjected to RT-PCR with primers specific for T cell receptor β chain V(D)J-Cβ rearrangements (tcrb: vb1.5, vb12, vb14.5), B cell immunoglobulin M heavy chain gene rearrangements (ighm: vh1, vh4), and β-actin (actb) as a control (A) RT-negative controls yielded no products (data not shown) (n = 2). (B) Adult kidney derived total RNA was subjected to qRT2-PCR with gene markers of T cells (cd4, tcra), B cells (ighm, cd79a), NK cells (nklb), neutrophils (mpo), and monocyte/macrophages (mpeg1.1) (B) Data was normalized relative to actb and represented as relative fold change compared to wild-type fish, with mean and SD shown in red and statistical significance indicated (**: p < 0.01, ***: p < 0.001, n = 6). Histological analysis (C–H) Representative images of Giemsa-stained kidney (C,D) and blood (E,F) cells were obtained from WT (C,E) and KO (D,F) fish. Abbreviations: e, erythrocyte; l, lymphocyte; n, neutrophil; p, precursor. Differential counts of kidney (G) and blood (H) cells, showing results for individual embryos, with mean and SD in red and statistical significance indicated (*: p < 0.05, **: p < 0.01, ***: p < 0.001, kidney: n = 11–12, blood: n = 6).