
|
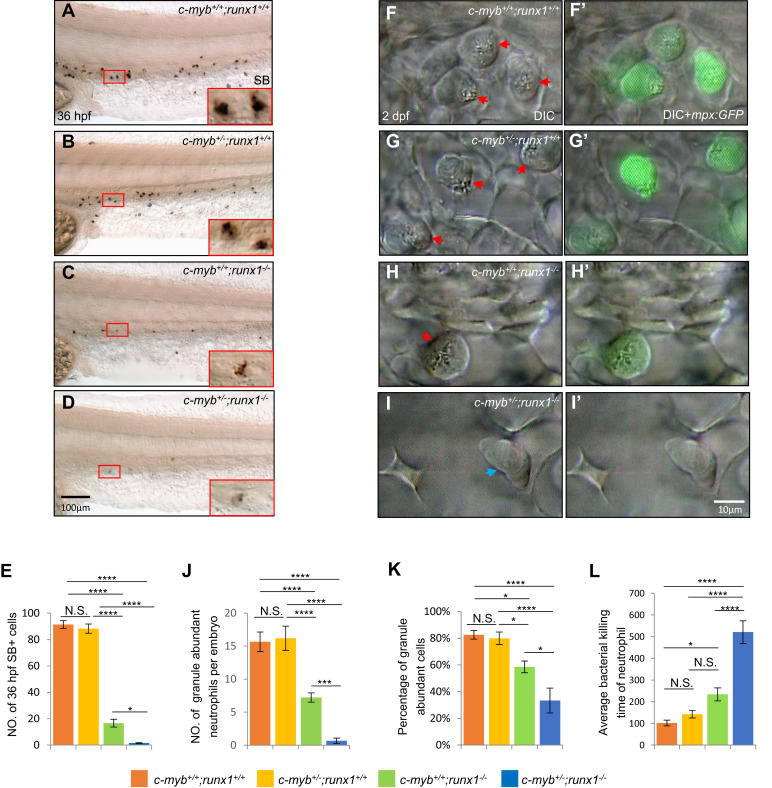
Fig. 2 c-Myb and Runx1 synergistically regulate neutrophil maturation. A–E, SB staining showed further decrease in intensity and number of SB+ cells in 36-hpf c-myb+/−;runx1−/− double mutants (D) compared with single mutants. Red boxes show enlarged detail of SB+ cells in each group (×4). E, quantification of numbers of 36-hpf SB+ cells (each n ≥ 18). (F–I and F’–I’) In vivo VE DIC microscopy revealed further reduction of granules in neutrophils in 2-dpf double mutants (I and I’) compared with single mutants (G, H, G’ and H’) in Tg(mpx:GFP) background (each n ≥ 15). Red arrowheads indicate matured neutrophils with abundant granules. Blue arrowheads indicate immature neutrophils with pale granules. J–K, quantification of absolute numbers of granule abundant-neutrophils per embryo (J) and relative percentage of granule-abundant cells in total mpx:GFP+ neutrophils (K), each n ≥ 15. Scale bars equal 10 μm. L, neutrophil bacterial clearance time in each group. Scale bars, 100 μm (A–D), and 10 μm (F–I and F’–I’).