
Figure 4
- ID
- ZDB-IMAGE-211201-175
- Genes
- Antibodies
- Publication
- Chen et al., 2021 - Knockout of mafba Causes Inner-Ear Developmental Defects in Zebrafish via the Impairment of Proliferation and Differentiation of Ionocyte Progenitor Cells
- All Figures
- Figures for Chen et al., 2021
|
Figure 4
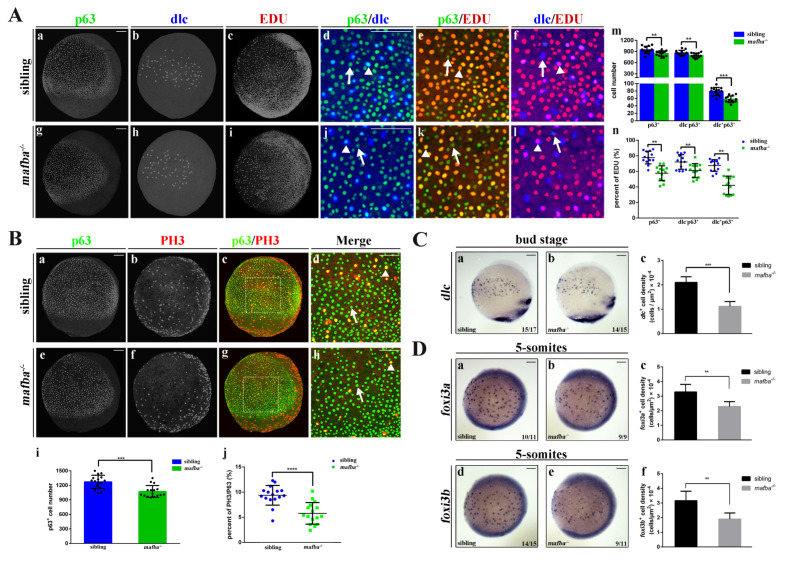
Knockout of mafba reduced the proliferation of epidermal stem cells and the dlc+ ionocyte progenitor cell number. (A) Examples of p63 with dlc or p63 with EDU or dlc with EDU colocalized (arrowhead) or non-colocalized (arrow) cells between sibling and mafba−/− groups are shown in (a–l). The quantitative analyses of the p63+ (marker for epidermal stem cells), dlc−p63+ (marker for keratinocyte precursors), and dlc+p63+ (marker for ionocyte precursors) cells in each group at the bud stage are shown in (m). The quantitative analyses of p63+, dlc−p63+, and dlc+p63+ cells colocalized with EDU (S-phase cells) in sibling and mafba−/− embryos at the bud stage are shown in (n). The n = 13 for each panel. Scale bars: 100 µm. (B) Double staining of p63 and pH3 (M-phase cells) in the siblings and mafba−/− group at the bud stage. Examples of p63 and pH3 colocalized (arrowhead) or non-colocalized (arrow) cells are shown. The quantitative analyses of p63+ cell and p63+ colocalized with pH3-positive cells of sibling and mafba−/− embryos at the bud stage are shown in (i) and (j), respectively. The n = 16 for each panel. Scale bars: 100 µm. (C) The dlc+ ionocyte progenitors’ cell density was reduced in the mafba−/− group (b) as compared to the sibling group (a) at the bud stage. The quantitative analysis of dlc+ ionocyte progenitors’ cell densities are shown in (c). (D) The cell density of foxi3a+ and foxi3b+ ionocyte progenitors are compared between the sibling (a,d) and mafba−/− group (b,e) at the 5-somites stage, respectively. Cell densities of foxi3a+ and foxi3b+ ionocyte progenitors are quantified in (c) and (f), respectively. Scale bars: 100 µm. Data are expressed as mean ± SD; **, p < 0.01; ***, p < 0.001; ****, p < 0.0001.