
|
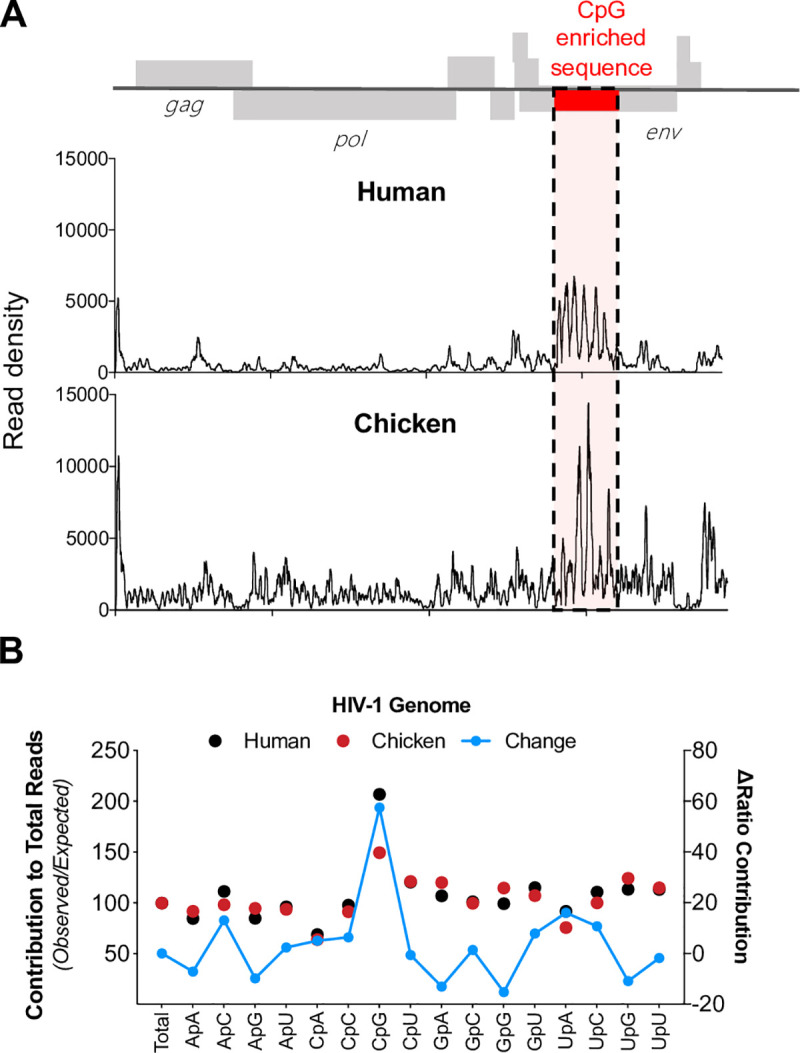
Fig 8
(A) HEK293T ZAP-/- and TRIM25-/- cells were transfected with an HIV-1CG proviral plasmid and a plasmid expressing human ZAP or chicken ZAP chimera. Cells were treated with 4-thiouiridine prior to UV-crosslinking and CLIP analysis. Reads associated with human (top) or chicken (bottom) ZAP were mapped to the HIV-1CG genome and the read density plotted against position in the HIV-1CG genome. CpG-enriched region the HIV-1CG genome is highlighted in red and dashed lines. (B) Contribution (% observed/expected) for each dinucleotide to reads derived from the HIV-1CG genome to was calculated. Shift in the ratio for each dinucleotide contribution comparing human and chicken ZAP reads was also determined (blue line).