IMAGE

FIGURE 1

ID
ZDB-IMAGE-210530-16
Genes
Source
Figures for Gong et al., 2021
Image
Figure Caption

FIGURE 1

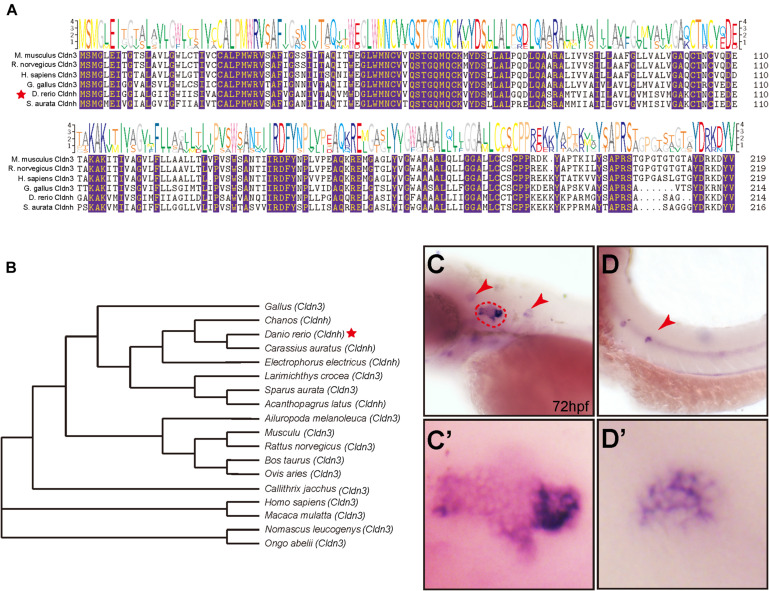
The phylogenetic and expression analysis of zebrafish claudin h. (A) The alignment of claudin h amino acid sequences from different species, and the identical aa residues among all the aligned sequences are labeled with color. (B) Phylogenetic analysis of claudin h. Neighbor-joining tree was produced with the Mega 5.0 software and the red star marked the zebrafish. (C,D) At 72 hpf, the in situ hybridization signal of claudin h is localized in the otic vesicle and neuromast. The red dotted line marked the boundary of the otic vesicle and the red arrow head marked the neuromast in the head and posterior lateral line. (C′,D′) The magnified figure of the positive signals in otic vesicle and neuromast line.

Figure Data
Acknowledgments
This image is the copyrighted work of the attributed author or publisher, and ZFIN has permission only to display this image to its users. Additional permissions should be obtained from the applicable author or publisher of the image. Full text @ Front Cell Dev Biol