
|
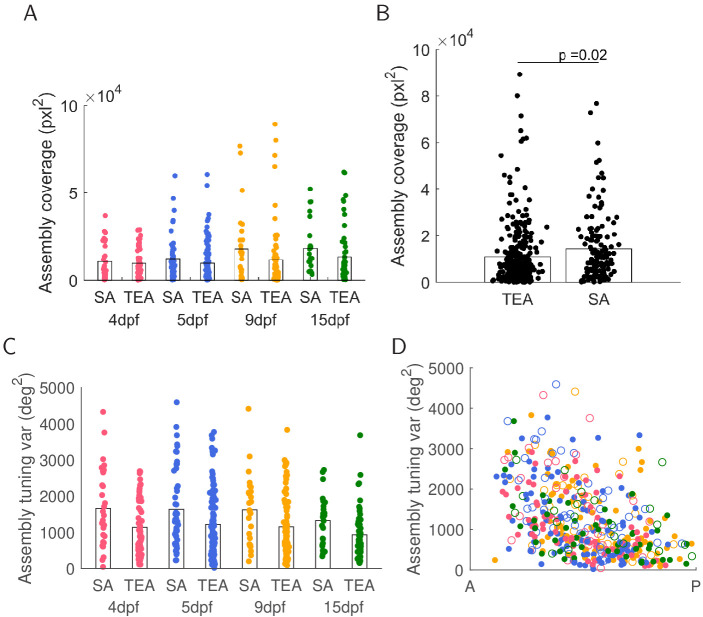
Figure 2—figure supplement 1. (A) The area covered by the smallest polygon bounding the assembly shows no developmental trend (one-way ANOVA). (B) The area covered by spontaneous activity (SA) assemblies is larger than the area covered by evoked activity (TEA) assemblies (t-test). (C) Assembly tuning variance shows no developmental trend (one-way ANOVA, p=0.66, p=0.62 for SA and TEA respectively). (D) Tuning variance over the anterior-posterior (AP) axis shows a decrease in tuning variance as a function of the assembly centre of mass (CoM). Linear regression EA: p=10−4 for 4 dpf, p=10−4 for 5 dpf, p=10−4 for 9 dpf, p=10−4 for 15 dpf; SA: p=10−2 for 4 dpf, p=10−3 for 5 dpf, p=0.03 for 9 dpf, p=0.09 for 15 dpf.