IMAGE

Figure 1

ID
ZDB-IMAGE-210319-34
Genes
Source
Figures for Alhazmi et al., 2021
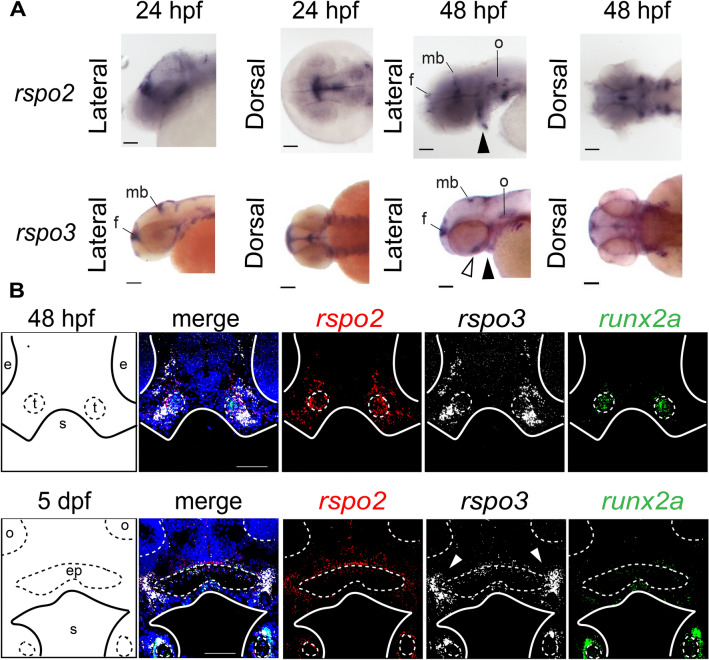
Image
Figure Caption

Figure 1

High resolution gene expression analysis detected dynamic spatiotemporal localization of rspo2 and rspo3 transcripts in zebrafish cranial mesenchyme. (A) Whole-mount RNA in situ hybridization detected rspo2 and rspo3 transcripts in the midbrain (mb), forebrain (f), otic vesicle (o), and Meckel’s cartilage (arrowhead) at 24 and 48 hpf in lateral and dorsal views. Transcript of rspo3 was additionally detected at 24 and 48 hpf in the forebrain (f) and at 48 hpf in the ethmoid plate (open arrowhead). Scale bar: 100 um. (B) Maximum projections of z-stacks of coronal sections of zebrafish embryos, section in plane with eyes. Labeled schematic at left. At 48 hpf, rspo2 and rspo3 transcripts were highly co-localized in the mesenchyme surrounding the condensing trabeculae cartilage mesenchyme, marked by runx2a expression. rspo2 is also detected within the condensing mesenchyme at this timepoint. At 5 dpf rspo2 and rspo3 continue to be co-expressed in mesenchyme and perichondrium surrounding cartilage elements, specifically the ethmoid plate and Meckel’s cartilage. Rspo3 expression is particularly high in runx2a expressing osteogenic precursor cells associated with Meckel’s cartilage, as well as where the palatoquadrate meets the ethmoid plate (white arrowhead). Abbreviations: e: eye, o: olfactory organ, s: stomodeum, t: trabeculae. Scale bar: 100 μm.

Figure Data
Acknowledgments
This image is the copyrighted work of the attributed author or publisher, and ZFIN has permission only to display this image to its users. Additional permissions should be obtained from the applicable author or publisher of the image. Full text @ Sci. Rep.