
|
Figure 3
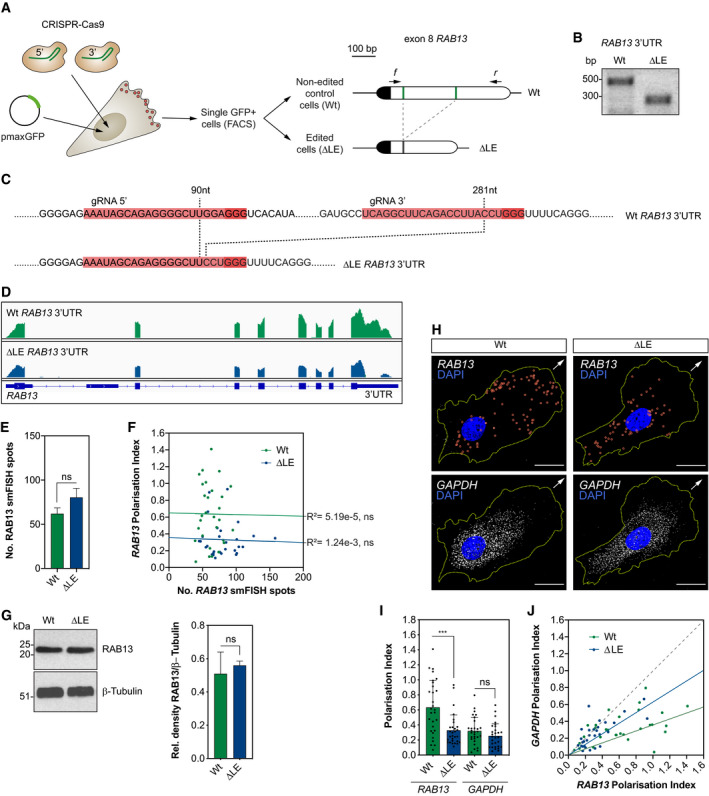
CRISPR‐Cas9 strategy to derive HUVECs with an excision of the LE in the Representative genotyping PCR demonstrates the band size shift in ∆LE HUVECs. Detailed DNA sequence depicting nucleotide positions within the Wt and ∆LE HUVEC RNAseq mapped reads depicting Quantification of Number of Left: representative Western blotting (WB) of Wt and ∆LE HUVECs. Right: densitometry analysis of WB data ( smFISH co‐detection of PI of
Data information: 3 Wt and 3 ∆LE HUVECs independent clones were used to collect data (E–J). Arrows indicate orientation of RNA localisation; yellow dashed lines outline cell borders; red circles highlight smFISH spots; scale bars = 20 μm (H). Bar charts are presented as means ± s.d.