
Figure 2
- ID
- ZDB-IMAGE-201003-178
- Genes
- Publication
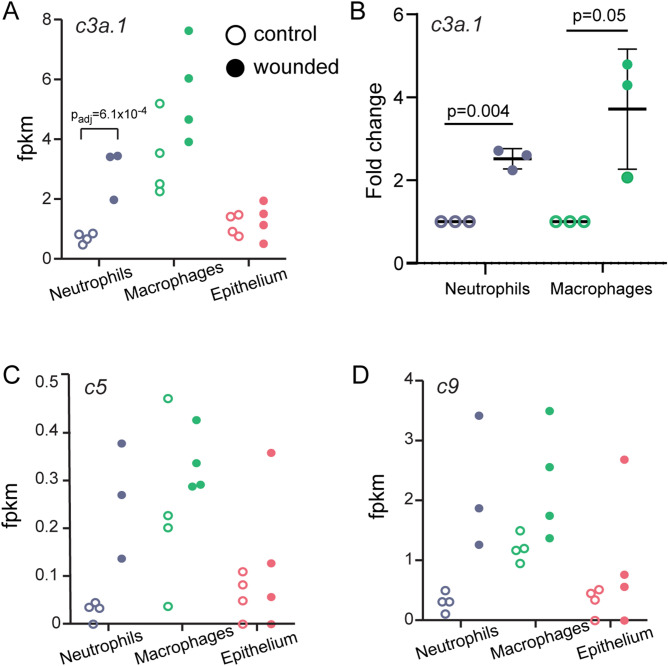
- Houseright et al., 2020 - Cell type specific gene expression profiling reveals a role for complement component C3 in neutrophil responses to tissue damage
- All Figures
- Figures for Houseright et al., 2020
|
Figure 2
TRAP-RNAseq identifies upregulation of the complement pathway and