
Fig. 2
- ID
- ZDB-IMAGE-200617-2
- Genes
- Publication
- Ahmed Alfar et al., 2017 - Distinct Levels of Reactive Oxygen Species Coordinate Metabolic Activity with Beta-cell Mass Plasticity
- All Figures
- Figures for Ahmed Alfar et al., 2017
|
Fig. 2
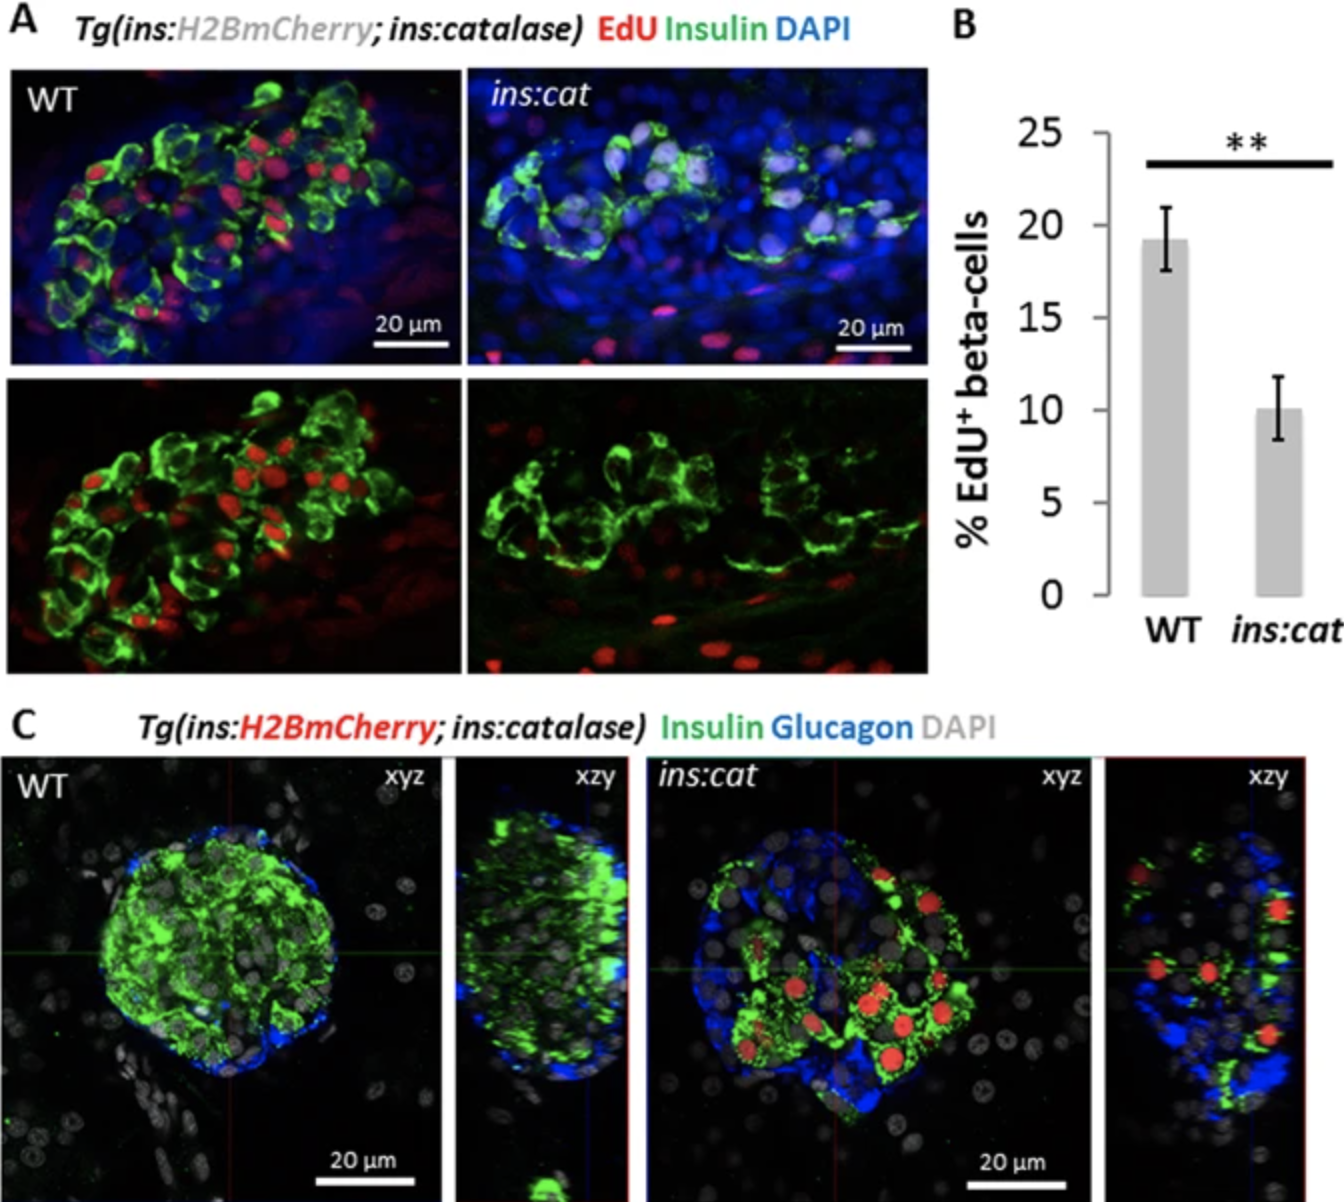
Catalase expression in beta-cells reduces beta-cell proliferation. (A) Confocal sections of principal islets from WT and Tg(ins:catalase;ins:H2BmCherry) siblings, incubated at 21 dpf with EdU for 16 hours (5 h after feeding). Fewer beta-cells incorporated EdU in Tg(ins:catalase;ins:H2BmCherry) compared to WT siblings. (B) Quantification of the percentage of EdU+ beta-cells in WT (n = 10) and Tg(ins:catalase;ins:H2BmCherry) (n = 11). Expression of catalase leads to a reduced percentage of EdU+ beta-cells compared to WT (p = 0,001). (C) Confocal planes (xzy) and 3D reconstructions (xzy) of smaller islets from WT and Tg(ins:catalase;ins:H2BmCherry) animals stained for insulin and glucagon. The beta-cells in the islet of the Tg(ins:catalase;ins:H2BmCherry) were scattered and fewer in numbers compared to WT. Alpha-cells in Tg(ins:catalase;ins:H2BmCherry) appear unaffected by the catalase expression in beta-cells. See also Figure S2 for maximum projections spanning the volume of principal islets in WT and Tg(ins:catalase;ins:H2BmCherry). Error bars = SEM.