
IMAGE
Figure 7
- ID
- ZDB-IMAGE-200406-233
- Publication
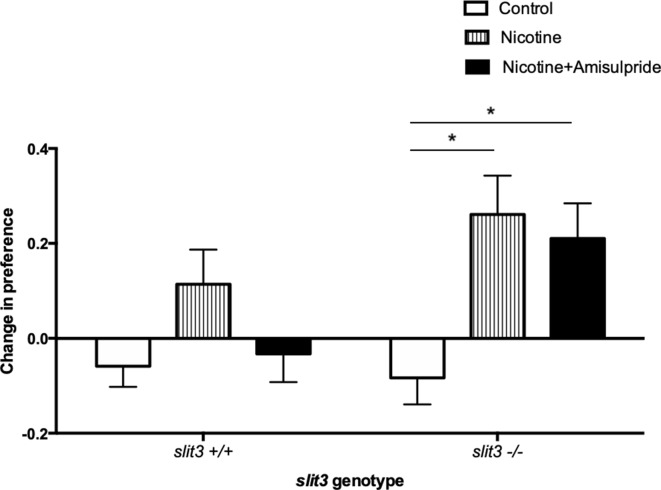
- García-González et al., 2020 - Identification of slit3 as a locus affecting nicotine preference in zebrafish and human smoking behaviour
- All Figures
- Figures for García-González et al., 2020
Image
|
Figure Caption
Figure 7
Bars represent mean (+ SEM). (n = 11–14 fish per group). *Two-way ANOVA followed by post-hoc Tukey tests (p<0.05).
Figure Data
Acknowledgments
This image is the copyrighted work of the attributed author or publisher, and
ZFIN has permission only to display this image to its users.
Additional permissions should be obtained from the applicable author or publisher of the image.
Full text @ Elife