IMAGE

Figure 2

ID
ZDB-IMAGE-200325-29
Source
Figures for Xiao et al., 2020
Image
Figure Caption

Figure 2

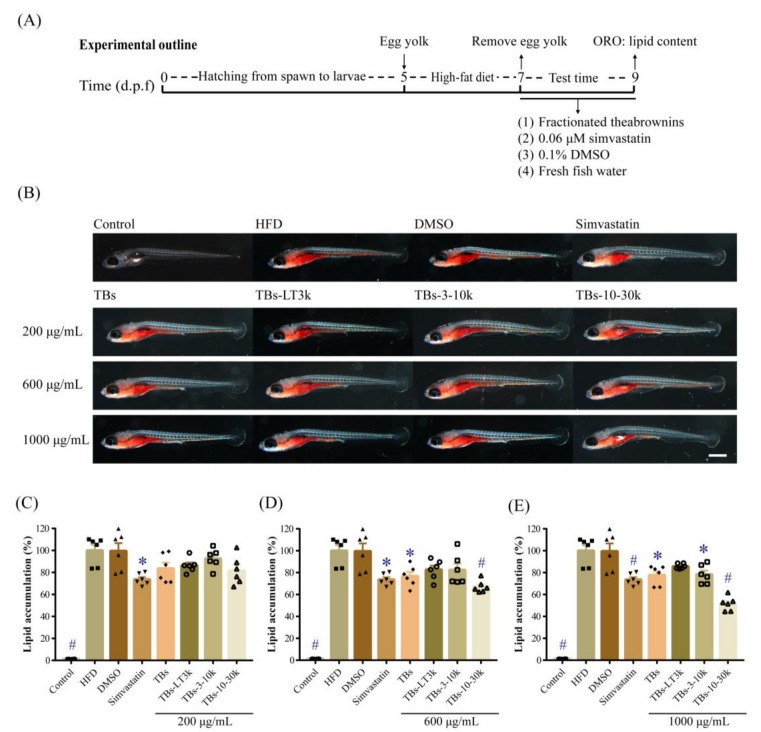
Hypolipidemic effect of theabrownins (TBs) and fractionated theabrownin samples with different molecular weights in high-fat-induced obesity zebrafish. (A) Experimental outline of zebrafish model. (B) Zebrafish stained with oil red O and visualized under a microscope magnified 30 times. (CE) Relative lipid accumulation in zebrafish treated with different concentrations of theabrownins. Data were expressed as mean ± SEM (n = 6). *p-value < 0.05 and #p-value < 0.001 compared to high-fat diet (HFD) group. HFD, high-fat diet-induced obesity zebrafish. DMSO, vehicle control at 0.1% (v/v). Simvastatin, positive control at 0.06 μM. TBs-LT3k, TBs-3-10k, and TBs-10-30k represented the fractionated theabrownin samples with molecular weights: <3 kDa, 3–10 kDa, and 10–30 kDa, respectively. Scale bar, 500 μm.

Figure Data
Acknowledgments
This image is the copyrighted work of the attributed author or publisher, and ZFIN has permission only to display this image to its users. Additional permissions should be obtained from the applicable author or publisher of the image. Full text @ Biomolecules