
|
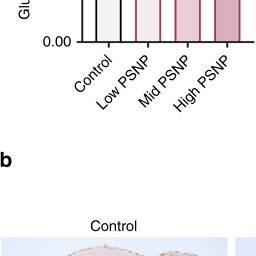
Fig. 3
Effects of PSNPs on glucose metabolism in larval zebrafish. a Dose-dependent response showing glucose concentrations in zebrafish embryos wild-type (AB/TL and gr+/+), glucocorticoid receptor mutant (gr−/−), and AB/TL supplemented with the glucocorticoid receptor antagonist mifepristone (1 µM; n = 4–5, pool of ten zebrafish per sample). b Representative image of insulin staining of the pancreas in control and 20 mg L−1 PSNP-exposed embryos (n = 7, biologically independent replicates). c Dose-response showing pck1 promoter dynamics in Tg(pck1:Luc2)zebrafish larvae at 120 hpf after exposure to 0.2 mg L−1 (low), 2 mg L−1 (mid), and 20 mg L−1(high) PSNPs from 72 to 120 hpf (n = 5, pool of three zebrafish per sample). Values are presented as mean ± SD. Asterisks indicate significant differences to controls (*p < 0.05, **p < 0.01, and ***p < 0.001)