
Fig. 5
- ID
- ZDB-IMAGE-190802-2
- Genes
- Publication
- Xue et al., 2019 - A 3D Atlas of Hematopoietic Stem and Progenitor Cell Expansion by Multi-dimensional RNA-Seq Analysis
- All Figures
- Figures for Xue et al., 2019
|
Fig. 5
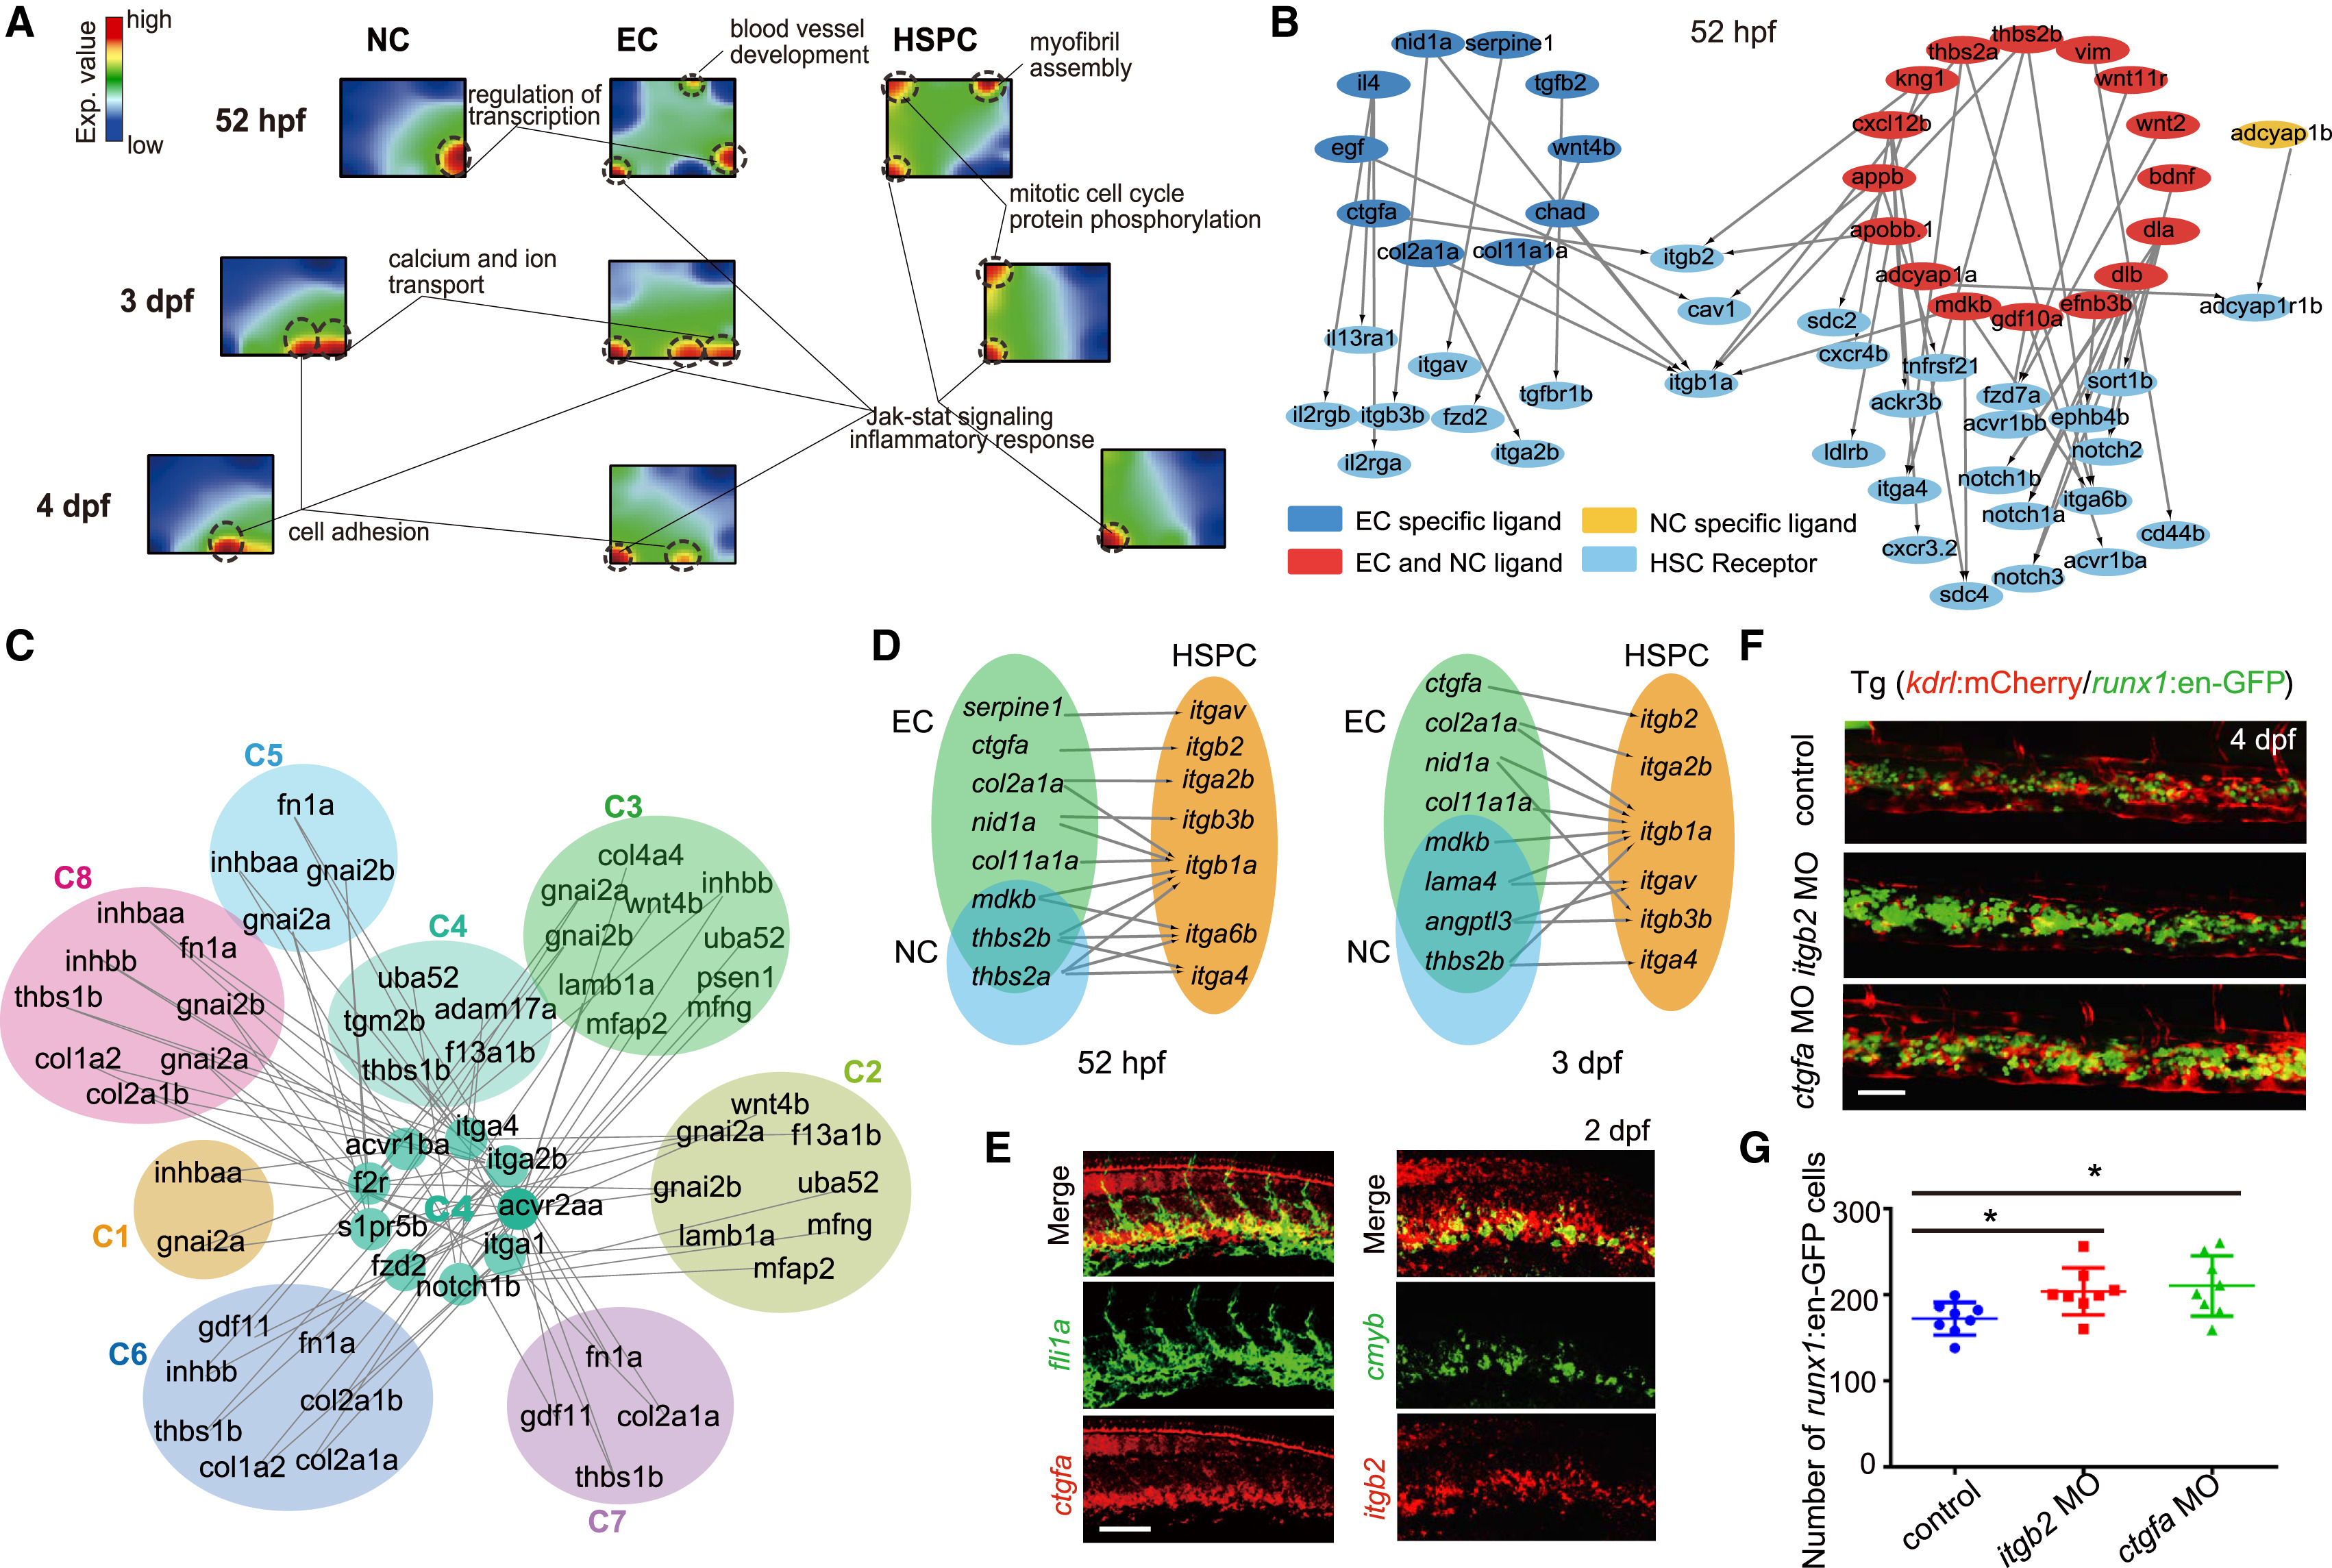
The Crosstalk between CHT Niche and HSPCs
(A) SOM showing the distinct gene regulatory structure among NCs, ECs, and HSPCs at 52 hpf and 3 and 4 dpf.
(B) Secretomics analysis showing the ligand-receptor regulatory relationship between HSPCs and CHT niche at 52 hpf.
(C) The secretomics analysis for scRNA-seq data revealing the interaction pairs in distinct cell types, receptor-expressing C4 (proliferating HSPC) and ligand-expressing clusters.
(D) The distribution of ligands and receptors in ECs (kdrl+ cells), HSPCs (CD41+cells), and NCs (kdrl-CD41- cells) at 52 hpf and 3 dpf based on bulk RNA-seqanalysis.
(E) Double FISH showing the co-expression of ctgfa with fli1a, and itgb2 with cmyb at 2 dpf. Scale bar, 50 μm.
(F) The confocal imaging of the transgenic line (kdrl:mCherry/runx1:en-GFP) showing the number of runx1+ cells in control, ctgfa morphants, and itgb2morphants at 4 dpf. Scale bar, 50 μm.
(G) The quantification of confocal imaging displayed in (F) are shown as means ± SEM. ∗p < 0.05, n = 8. The HSPCs were counted in about the eight-somite region of the CHT in control embryos and morphants.