
Figure 4—figure supplement 1.
- ID
- ZDB-IMAGE-190723-1941
- Genes
- Publication
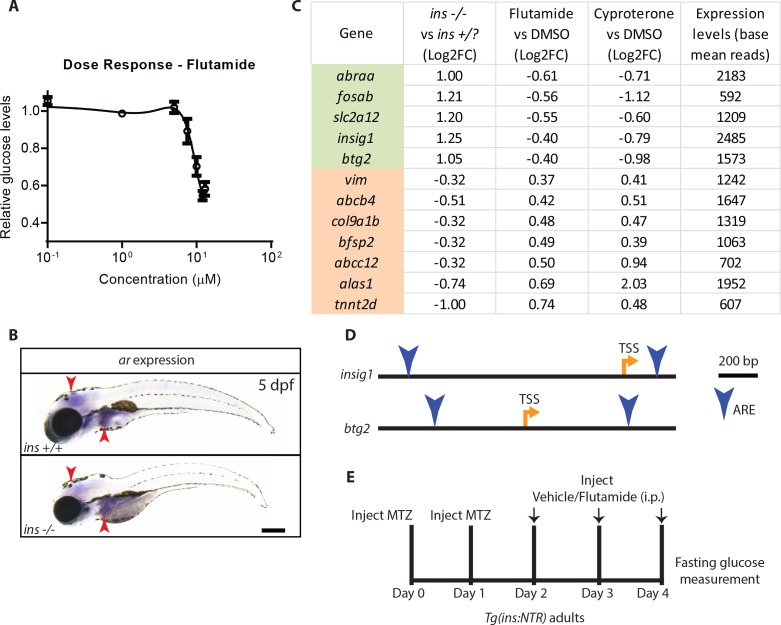
- Mullapudi et al., 2018 - Screening for insulin-independent pathways that modulate glucose homeostasis identifies androgen receptor antagonists
- All Figures
- Figures for Mullapudi et al., 2018
|
Figure 4—figure supplement 1.
(