
|
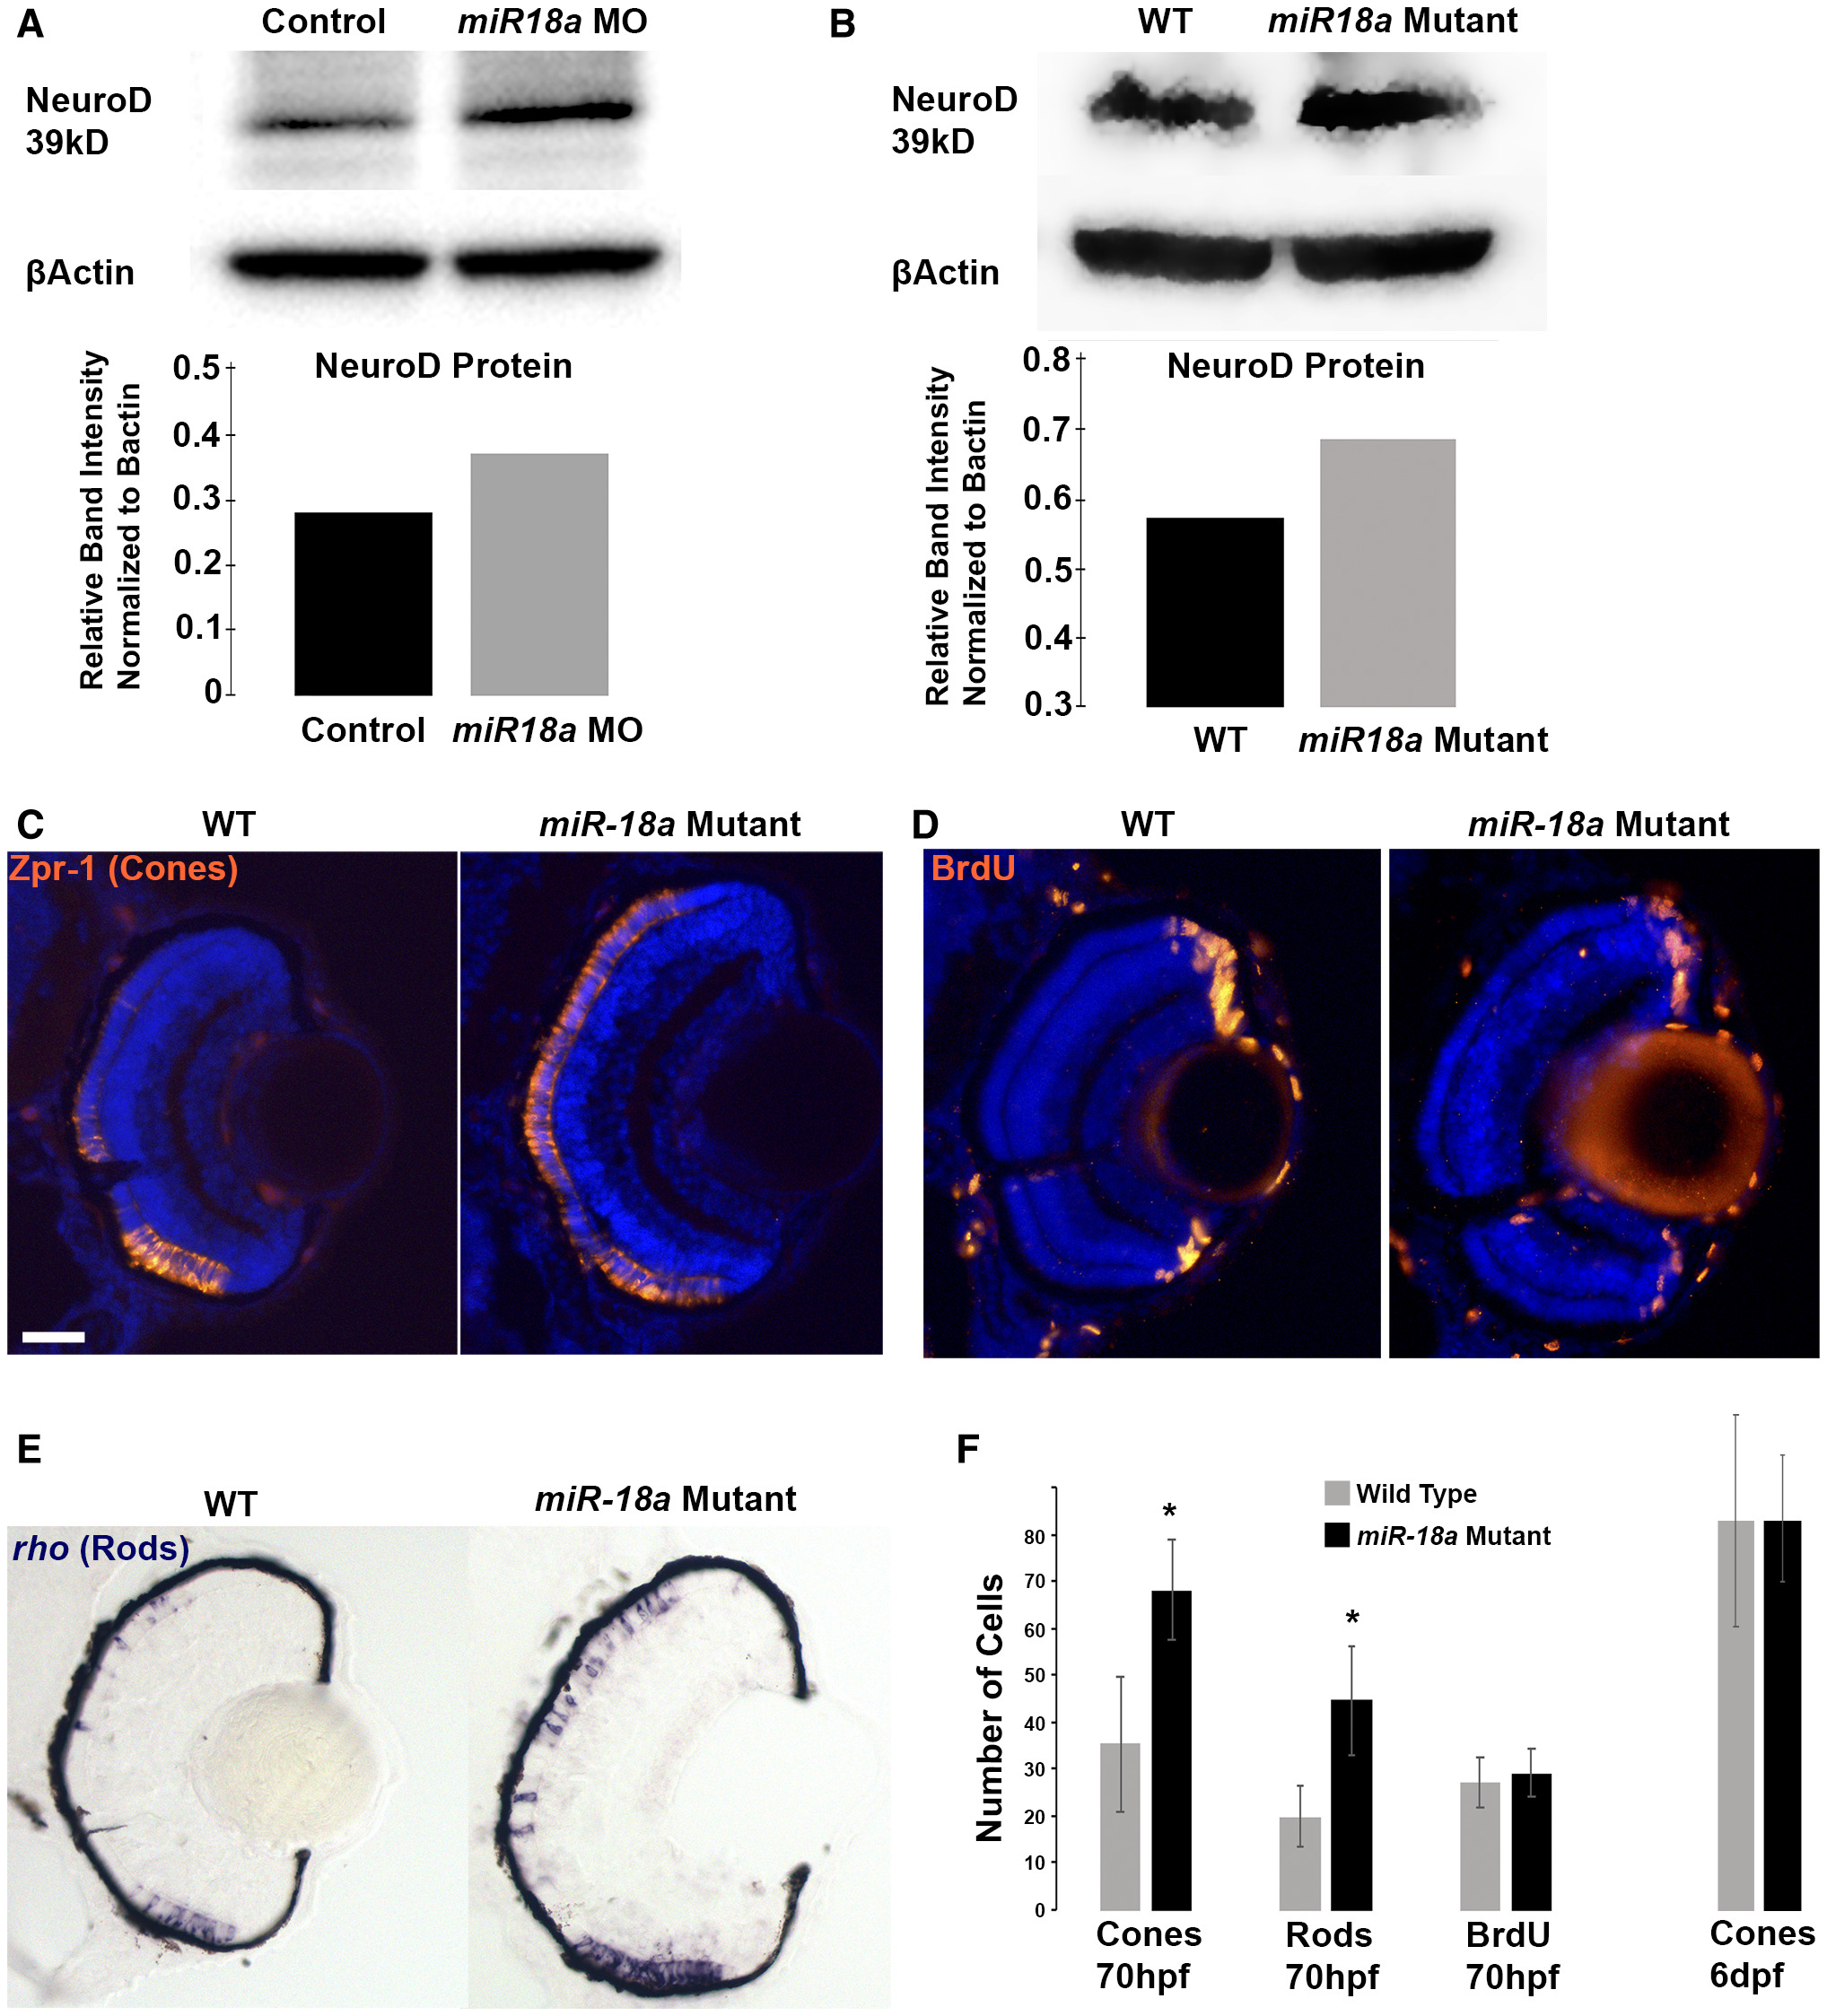
Fig. 5
Loss of miR‐18a increases NeuroD protein levels and the number of differentiated photoreceptors. Western blot on 48 hpf embryo heads (n = 40) comparing NeuroD protein levels between standard control MO‐injected and miR‐18a MO‐injected embryos (A) and between the WT and miR‐18a‐/‐‐mutant embryos (B) with corresponding quantification graphs. In the WT compared with the miR‐18a‐mutant larvae at 70 hpf, immunolabeling for mature cone photoreceptors (C: Zpr‐1) and cells in the S‐phase of the cell cycle (D: BrdU); and in situ hybridization for rod photoreceptors (E: rhodopsin); scale bar = 0.50 μm. (F) Quantification of cones (n ≥ 14 larvae), rods (n ≥ 8 larvae), and BrdU+ cells (n ≥ 7 larvae) in 70 dpf retinas. Error bars represent standard deviation; cell counts compared with a Student’s t test and asterisks indicate P < 0.05. [Colour figure can be viewed at wileyonlinelibrary.com]