
Fig. 1
|
Fig. 1
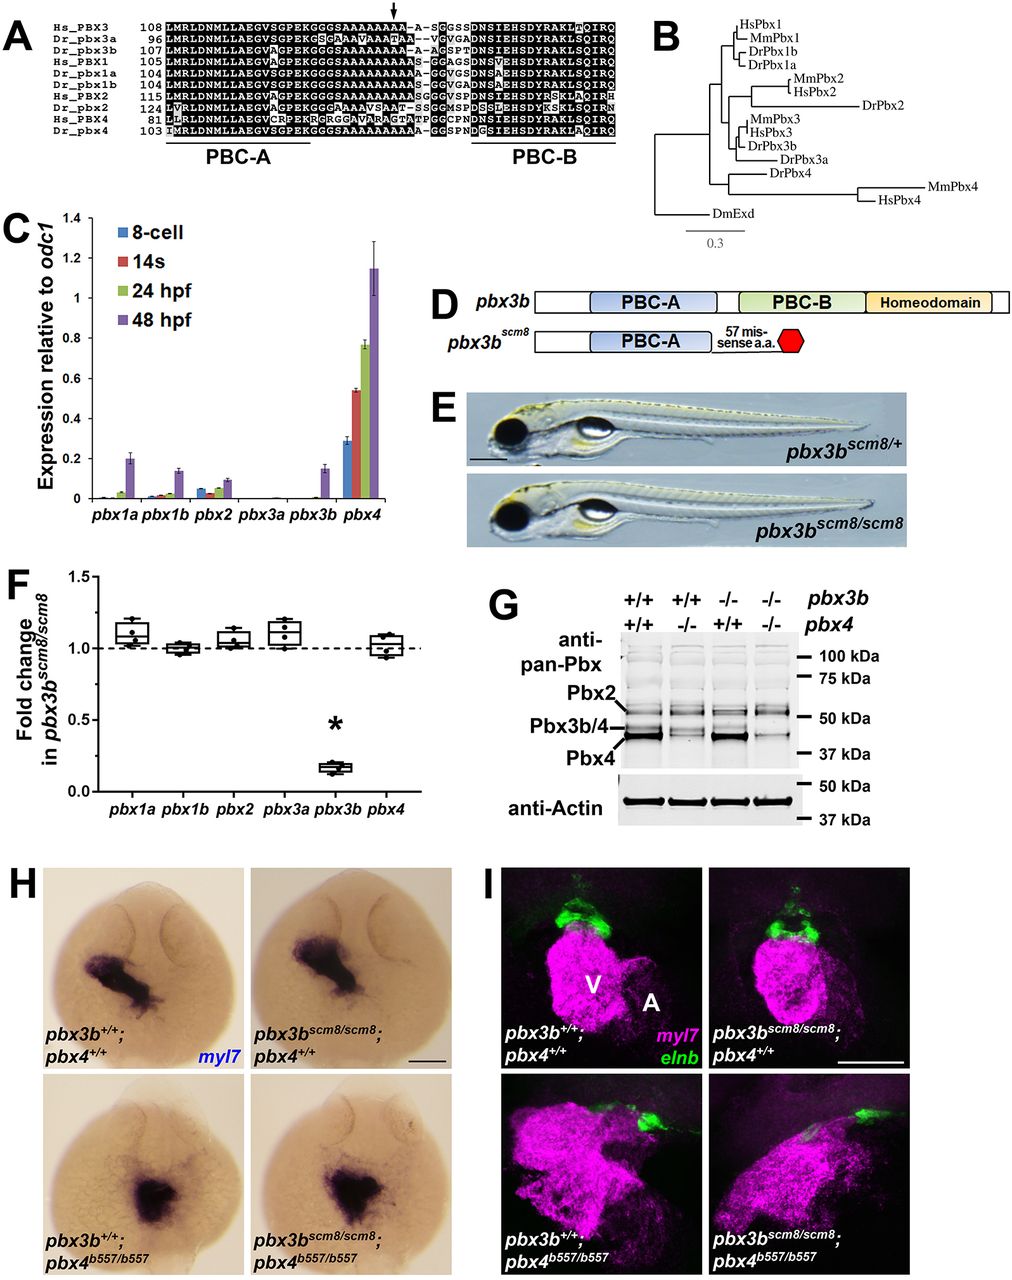
Zebrafish pbx4, but not pbx3b, is required for early cardiac morphogenesis. (A) Alignment of human (Hs) and zebrafish (Dr) Pbx proteins in the region of the polyalanine tract. Numbers indicate amino acid positions. Partial PBC-A and PBC-B domains are underlined. The arrow marks the position of amino acid 136 in human PBX3. (B) Phylogenetic analysis of human (Hs), mouse (Mm) and zebrafish (Dr) Pbx genes. DmExd is the Drosophila Pbx gene ortholog extradenticle. (C) qRT-PCR analysis of Pbx gene expression in wild-type zebrafish embryos at four embryonic stages: eight-cell (∼1.25 hpf), 14 somites (s; ∼16 hpf), 24 hpf and 48 hpf. Levels of expression of each Pbx gene are shown relative to the expression of odc1. Error bars represent standard deviations for three technical replicates. (D) Schematic of zebrafish Pbx3b protein domains and inferred domains encoded by the CRISPR-Cas9-generated pbx3bscm8 allele. (E) Images of live pbx3bscm8/+ and pbx3bscm8/scm8 larvae at 5 dpf. pbx3bscm8/scm8 larvae show no obvious heart or other defects at least up to 7 dpf (n=15, pbx3bscm8/scm8; n=14, pbx3bscm8/+; n=7, pbx3b+/+). Scale bar: 300 μm. (F) qRT-PCR analysis of Pbx gene expression in pbx3bscm8/scm8 embryos relative to sibling pbx3b+/+ embryos at 48 hpf. Levels of expression of each Pbx gene are normalized to the expression of eef1a1l1. Error bars represent standard deviations for four biological replicates. *P=0.0005, Student's t-test using Welch's correction for unequal standard deviations. (G) Western blot analysis of Pbx protein expression. pbx3scm8/scm8 and pbx4b557/b557 embryos were used to document identities of the proteins recognized by the anti-pan-Pbx antibody. The upper band is Pbx2, as previously described (Maves et al., 2007; Waskiewicz et al., 2002; G.H.F. and L.M., unpublished). Quantification of the middle band, normalized to Actin levels, shows that pbx3scm8/scm8 embryos have 65% of wild-type levels, pbx4b557/b557 embryos have 54% of wild-type levels and pbx3scm8/scm8;pbx4b557/b557 embryos have 10% of wild-type levels, demonstrating that the middle band consists of both Pbx3b and Pbx4. (H) Myocardial marker myl7 expression at 24 hpf appears normal in pbx3+/+;pbx4+/+ (n=11), pbx3scm8/scm8;pbx4+/+ (n=2) and pbx3scm8/scm8;pbx4b557/+ (n=15) embryos. pbx3+/+;pbx4b557/b557 (n=8) and pbx3scm8/scm8;pbx4b557/b557 (n=7) embryos show similarly disrupted early heart tube morphogenesis, as we previously described for pbx4b557/b557 embryos (Kao et al., 2015). Dorsal views; anterior is up. Scale bar: 50 μm. (I) Expression of myocardial marker myl7 (red) and outflow tract marker elnb (green) (Miao et al., 2007) at 60 hpf appears normal in pbx3+/+;pbx4+/+ (n=8) and in pbx3scm8/scm8;pbx4+/+ (n=9) embryos. pbx3+/+;pbx4b557/b557 (n=11) and pbx3scm8/scm8;pbx4b557/b557 (n=10) embryos show variably disrupted myocardial and outflow tract morphogenesis, similar to what we previously described for pbx4b557/b557 embryos (Kao et al., 2015). V, ventricle; A, atrium. Ventral views; anterior is up. Scale bar: 50 μm.