
Fig. 8
|
Fig. 8
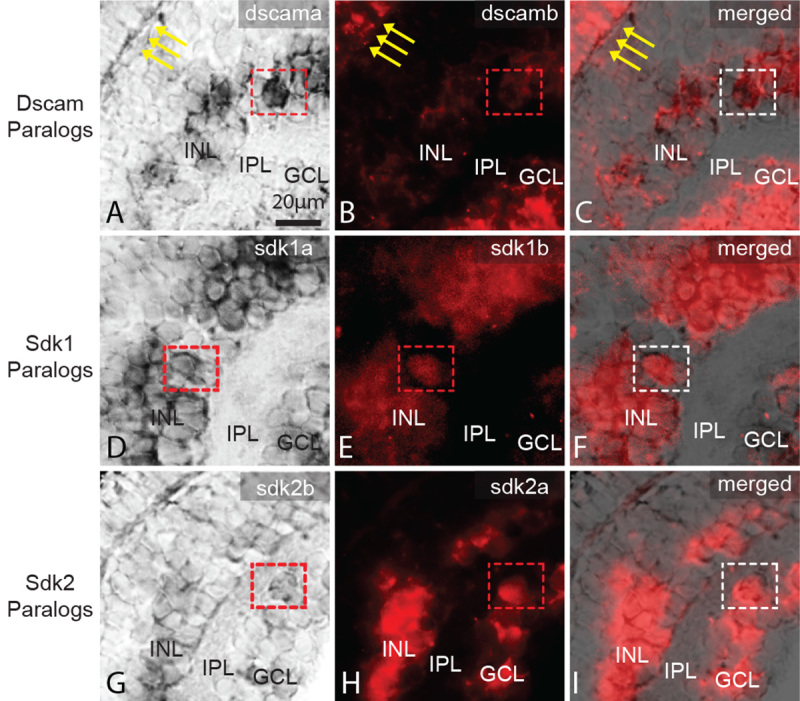
Expression of dscam and sdk paralogs in developing zebrafish central retina at 96 hpf. Comparative expression patterns of dscama versus dscamb, sdk1a versus sdk1b, and sdk2a versus sdk2b are shown following dual in situ hybridization. A: Expression of dscama was observed in the GCL and in the INL, but no expression was observed in the ONL (arrows). B: Expression of dscamb was observed in the GCL, INL, and ONL (arrows). C: Gene paralogs, dscama, and dscamb are co-expressed in some cells within the INL and GCL (boxed region), but only dscamb is expressed in the ONL (arrows). Yellow arrows point to the outer plexiform layer for viewer orientation. D: Expression of sdk1a was observed in the GCL and INL. E: Expression of sdk1b was seen in the GCL and INL. F: Gene paralogs sdk1a and sdk1b were co-expressed in some cells within the GCL and INL (boxed region). G: Expression of sdk2b was observed in the GCL and INL. H: Expression of sdk2a was observed in the GCL and INL. I: Gene paralogs sdk2a and sdk2b were co-expressed in some cells within the INL and GCL (boxed region). Dashed boxes show the identical region of interest (ROI) in each row. The red boxes correspond to the ROI for panels showing single-label expression in A, B, D, E, G, and H. White boxes in C, F, and I show ROIs of co-expression of paralogs. Abbreviations: hpf=hours post fertilization; Dscam=Down syndrome cell adhesion molecule; Sdk=sidekick; ONL=outer nuclear layer; INL=inner nuclear layer; GCL=ganglion cell layer. Scale bar in A=20 μm (applies to all).