
Fig. 1
- ID
- ZDB-IMAGE-180911-40
- Genes
- Antibodies
- Publication
- Oosterhof et al., 2018 - Colony-Stimulating Factor 1 Receptor (CSF1R) Regulates Microglia Density and Distribution, but Not Microglia Differentiation In Vivo
- All Figures
- Figures for Oosterhof et al., 2018
|
Fig. 1
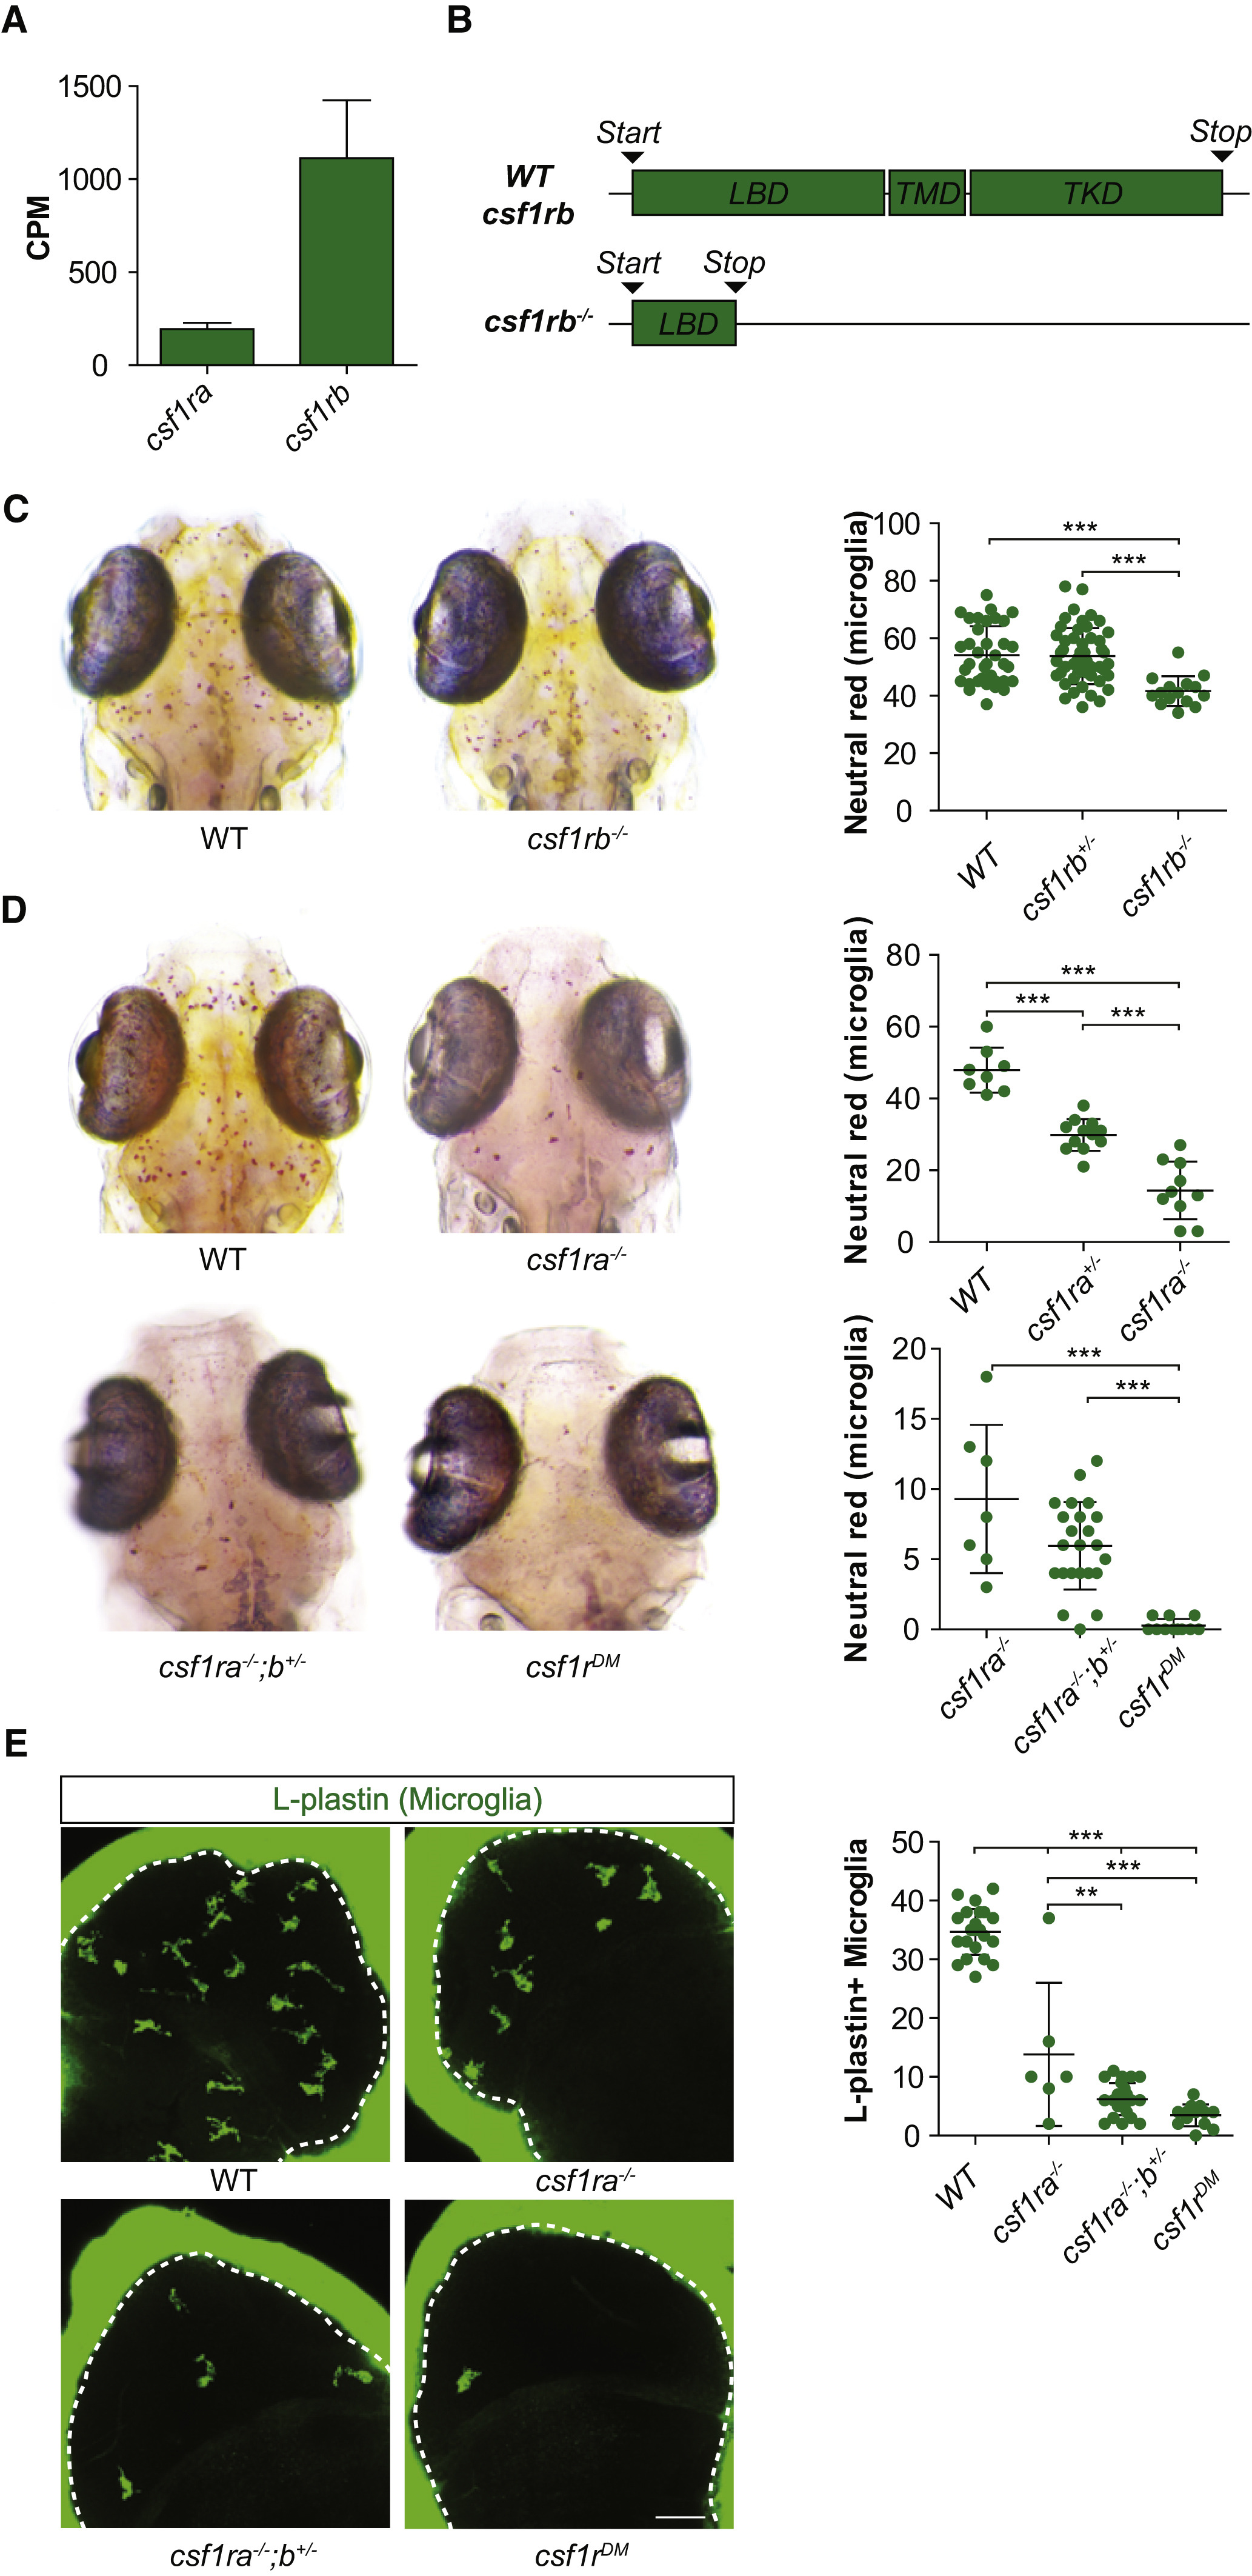
Microglia Numbers during Development Are csf1r Dosage-Dependent
(A) Counts per million (CPM) expression values of csf1ra and csf1rb from our previous RNA sequencing study in adult zebrafish microglia (Oosterhof et al., 2017).
(B) Schematic representation of the csf1rb mutation introduced with TALEN-mediated genome editing.
(C and D) 5 days post fertilization (dpf), WT, csf1ra−/−, csf1rb−/−, csf1ra−/−;b+/−, and csf1rDM larvae were treated with neutral red for 2.5 hr. Images were acquired with a stereomicroscope, and microglia numbers were determined by counting the number of neutral red dots. n is at least 15 zebrafish/genotype for (C) and at least 7 for (D).
(E) 4 dpf, WT, csf1ra−/−, csf1ra−/−;b+/− and csf1rDM were labeled with an antibody against L-plastin (Spangenberg et al., 2016), and L-plastin-positive cells were quantified in the optic tecti. n is at least 6 zebrafish/genotype.
LBD, ligand-binding domain; TMD, transmembrane domain; TKD, tyrosine kinase domain. Error bars represent SD. ∗∗p < 0.01, ∗∗∗p < 0.001 (one-way ANOVA, Bonferroni multiple testing correction). Scale bar, 40 μm.