
Fig. 5
- ID
- ZDB-IMAGE-180817-8
- Genes
- Antibodies
- Publication
- Mahony et al., 2018 - Oncostatin M and Kit-Ligand Control Hematopoietic Stem Cell Fate during Zebrafish Embryogenesis
- All Figures
- Figures for Mahony et al., 2018
|
Fig. 5
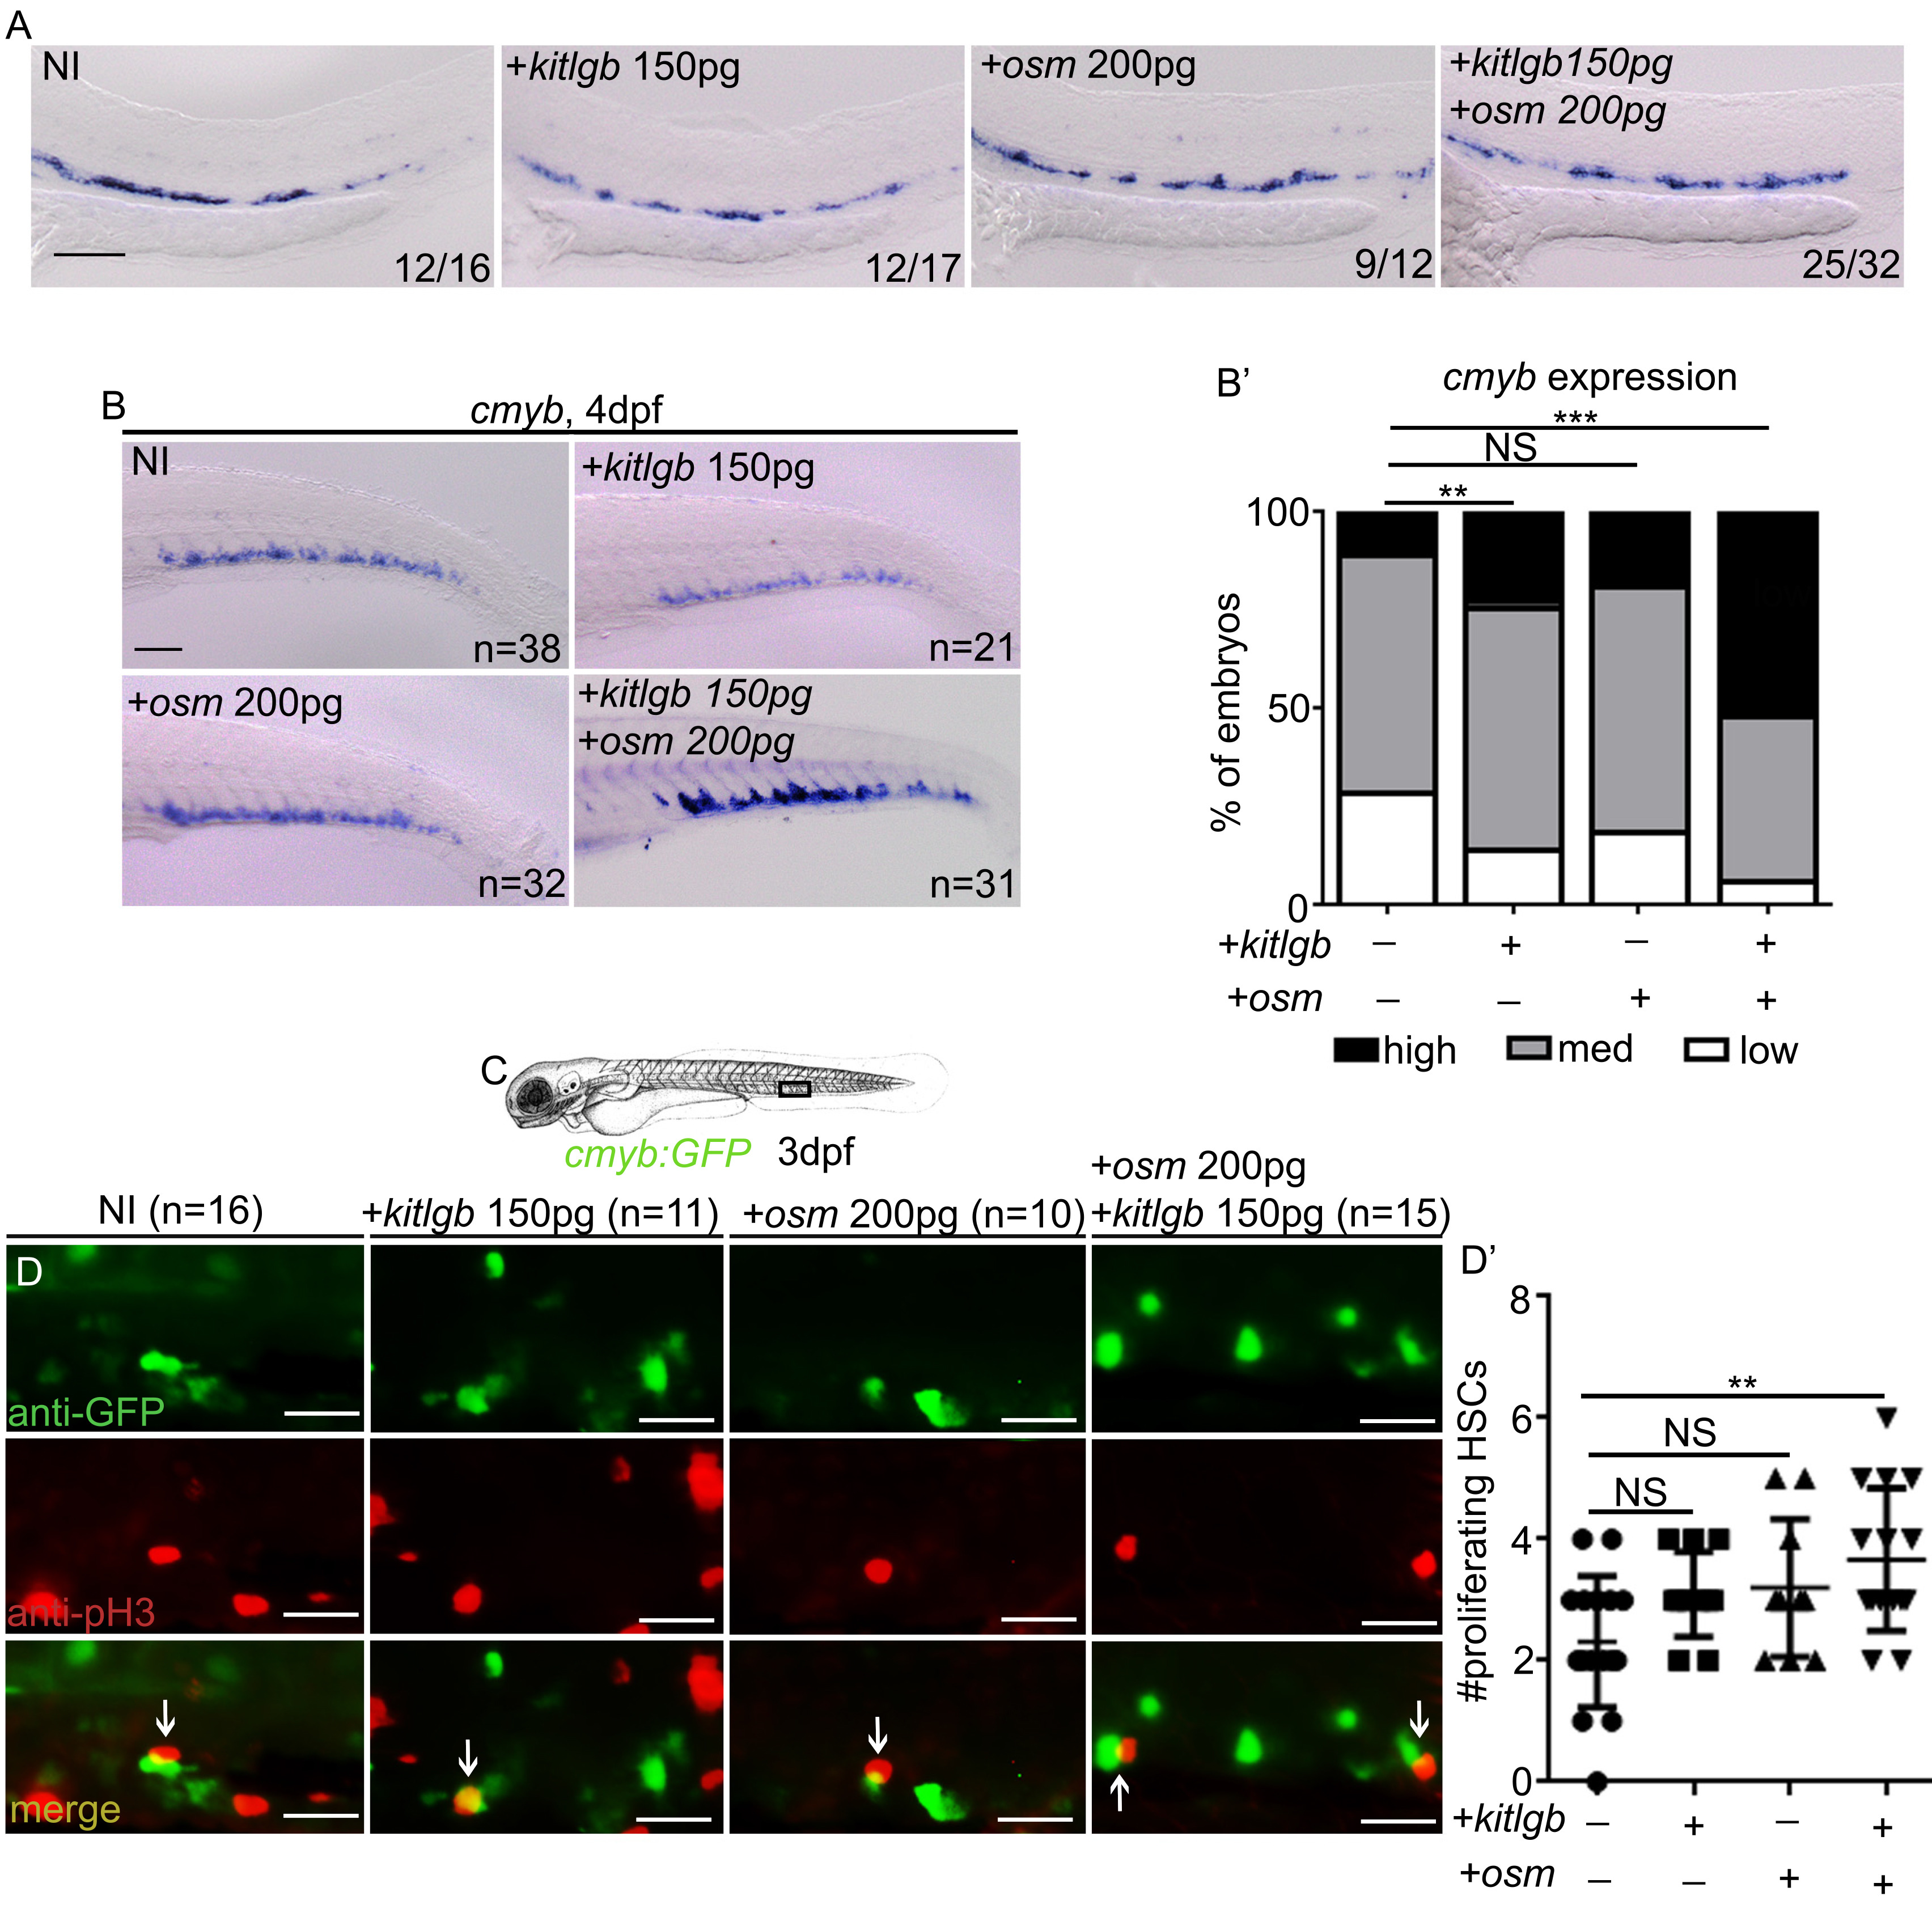
osm and kitlgb Signal Synergistically to Expand HSCs in the CHT
(A) runx1 ISH at 28 hpf in NI embryos and kitlgb or osm mRNA-injected embryos (injected separately and together) at subliminal doses. Scale bar, 100 μm.
(B) cmyb ISH at 4 dpf in NI embryos and kitlgb or osm mRNA-injected embryos (injected separately and together) at subliminal doses. Scale bar, 100 μm.
(B′) cmyb expression analysis. Analysis is Fisher's exact test. NI versus kitlgb, p = 0.29; NI versus osm, p = 0.48; NI versus kitlgb + osm, p = 0.0001.
(C) Imaging schematic.
(D) Immunofluorescence for GFP and pH3. Arrows represent double-positive, proliferating cells. Scale, 25 μm.
(D′) Quantification of double-positive cells. (D′) Data are means ± SD and analysis is an ordinary one-way ANOVA with multiple comparisons. ANOVA p value = 0.0082. ∗∗∗p < 0.001; ∗∗p < 0.01; NS, p > 0.05.