Fig. 4
Fig. 4
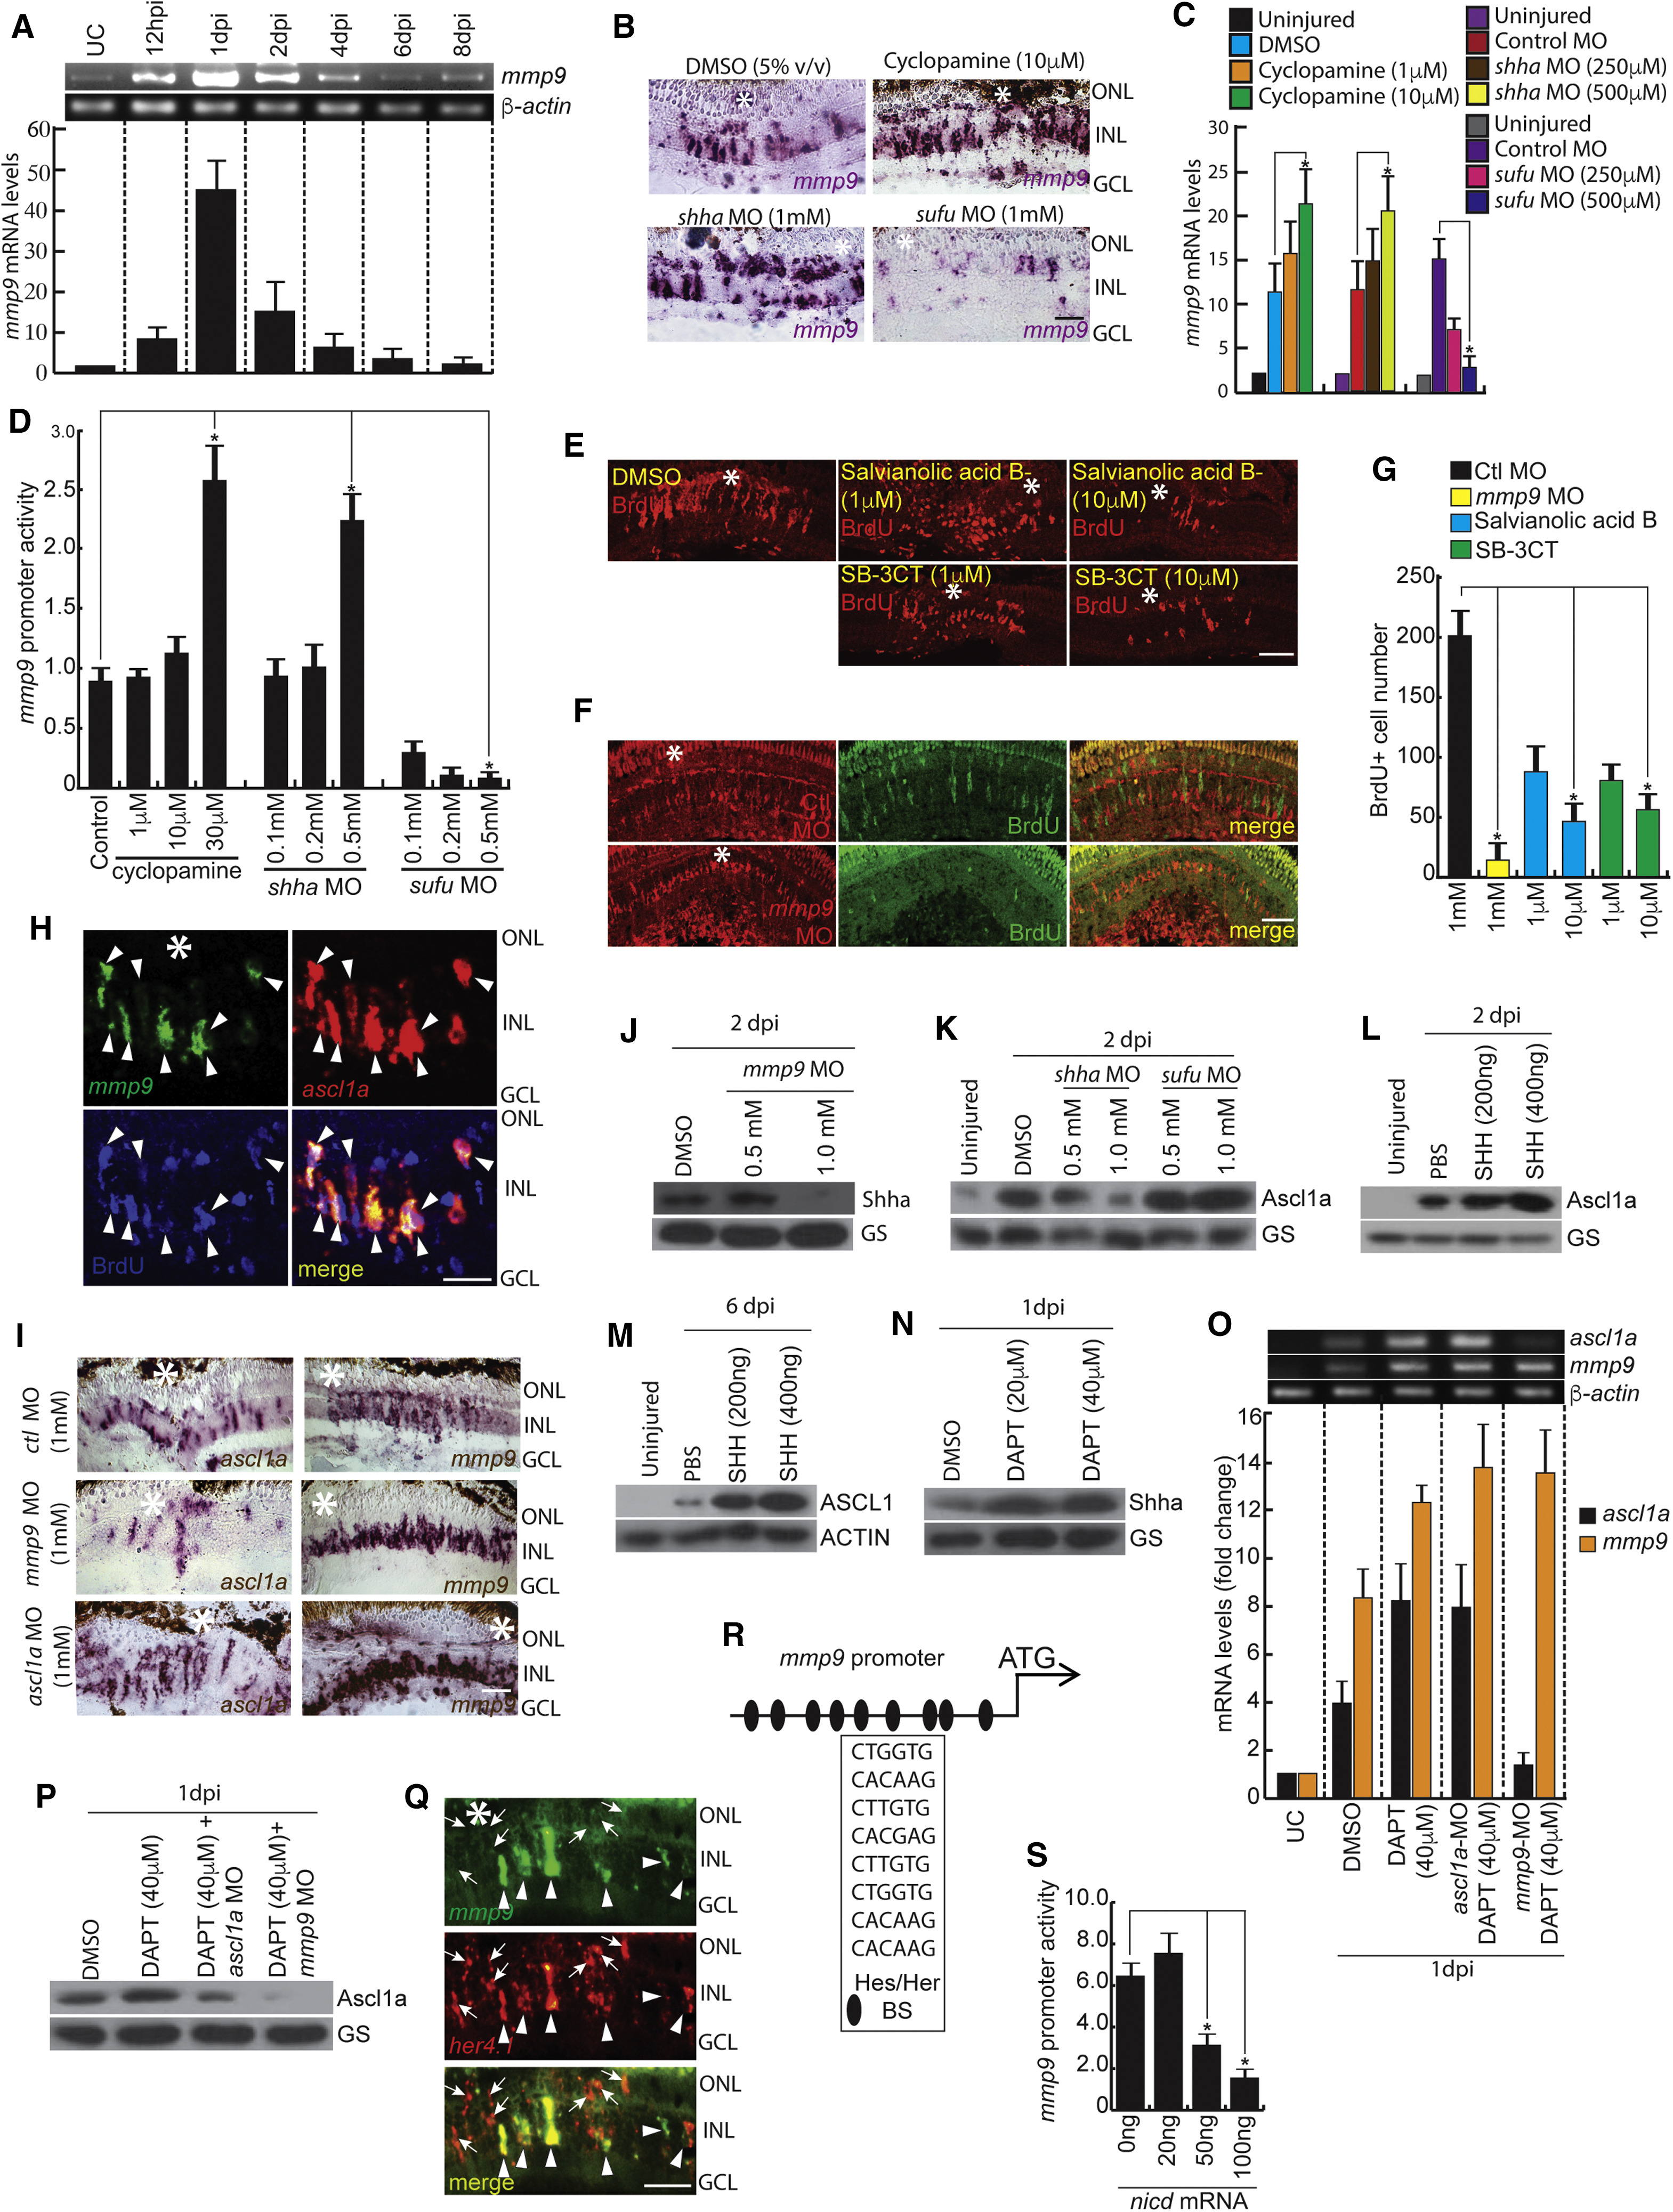
Shh-Mmp9-Ascl1a Interplay Is Necessary during MG Reprogramming
(A) RT-PCR (top) and qPCR (bottom) analysis of injury-dependent mmp9 expression in the retina; n = 6 biological replicates.
(B–D) BF microscopy images of mmp9 mRNA ISH in the retina at 4 dpi with cyclopamine treatment and shha or sufu knockdown (B), as quantified by qPCR (C), and a luciferase assay in 24 hpf embryos injected with mmp9:GFP-luciferase vector (D).
(E–G) IF microscopy images of 4 dpi retina with Mmp9 blockade using drugs (E) and MO against mmp9 (F). The number of BrdU+ MGPCs is quantified in (G).
(H) FISH and IF microscopy images of a 0.5-μm-thick optical section of retina showing co-localization of mmp9 and ascl1a in BrdU+ MGPCs at 4 dpi. Arrowheads mark co-expression of genes in BrdU+ cells.
(I) BF microscopy images of ascl1a and mmp9 mRNA ISH in ascl1a and mmp9 knockdowns in 4 dpi retina.
(J) Western blotting experiment showing Shh levels in 2 dpi retina with the mmp9 knockdown.
(K) Western blotting assay of Ascl1a in 2 dpi retina with shha or sufu knockdowns.
(L) Western blotting assay of Ascl1a in 2 dpi zebrafish retina injected with recombinant SHH protein.
(M) Western blotting assay of ASCL1 in 6 dpi mouse retina injected with recombinant SHH protein.
(N) Western blotting assay of Shha in DAPT-treated retina at 1dpi.
(O and P) RT-PCR (top) and qPCR (bottom) analysis of ascl1a and mmp9 in DAPT-treated retina, with or without ascl1a or mmp9 knockdown (O), and confirmed by western blotting assay (P).
(Q) FISH and IF microscopy images of a 0.5-μm-thick optical section of retina showed substantial co-exclusion and marginal co-localization of mmp9 with her4.1 at 4 dpi. Arrowheads mark co-expression of the gene, and arrows mark her4.1+ cells.
(R and S) Schematic of the mmp9 promoter with potential Hes/Her-BS binding sites (inside box), and luciferase assay in 24 hpf embryos co-injected with mmp9:GFP-luciferase construct and notch intracellular domain (nicd) mRNA (S).
Scale bars represent 10 μm (H and Q) and 20 μm (B, E, F, and I). Asterisk indicates the injury site (B, E, F, H, I and Q). Error bars represent SD. ∗p < 0.001 (C, D, G, and S). Biological replicates n = 6 in (C) and (G), and n = 3 in (D) and (S). See also Figures S3, S4, S6, and S7.

