
Fig. S6
- ID
- ZDB-IMAGE-180705-59
- Publication
- Williams et al., 2018 - Gon4l regulates notochord boundary formation and cell polarity underlying axis extension by repressing adhesion genes
- All Figures
- Figures for Williams et al., 2018
|
Fig. S6
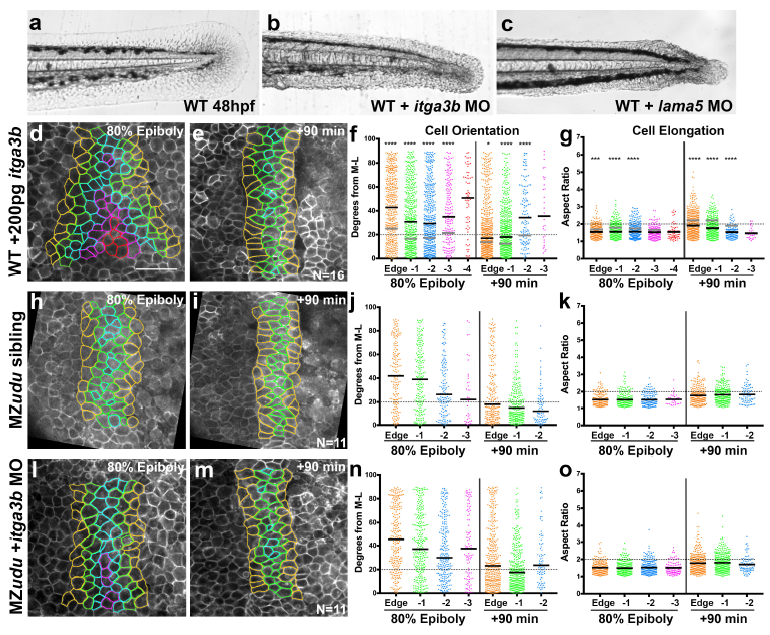
Reduction of Integrinα3b does not suppress cell polarity defects in MZudu-/- gastrulae
a-c) Live images of caudal fins of an uninjected WT embryo (a) and those injected with 2ng itga3b MO (b) or 1ng lama5 MO (c) at 48hpf (note recapitulation of mutant phenotypes1). Images are representative of all MOinjected embryos from three (itga3b) or four (lama5) independent trials. d-g) Quantification of axial mesoderm cell orientation (f) and elongation (g) in itga3b overexpressing WT gastrulae. Asterisks indicate significant differences compared to WT controls (Kolmogorov-Smirnov (f) and Mann-Whitney (g) tests, *p<0.05, ***p<0.001, ****p<0.0001). Black bars are median values in f, mean values in g; medians and means of WT are shown as gray bars in f-g. h-o) Quantification of axial mesoderm cell orientation and elongation in control MZudu-/- siblings (h-k) and MZudu-/- injected with 2ng itga3b MO (l-o) at the time points indicated. Graphs and color coding as in Fig.3. Bars are median values in j, n; bars are mean values in k, o. N indicates the number of embryos analyzed, scale bar is 50μm.