
Fig. 3
- ID
- ZDB-IMAGE-180705-50
- Antibodies
- Publication
- Williams et al., 2018 - Gon4l regulates notochord boundary formation and cell polarity underlying axis extension by repressing adhesion genes
- All Figures
- Figures for Williams et al., 2018
|
Fig. 3
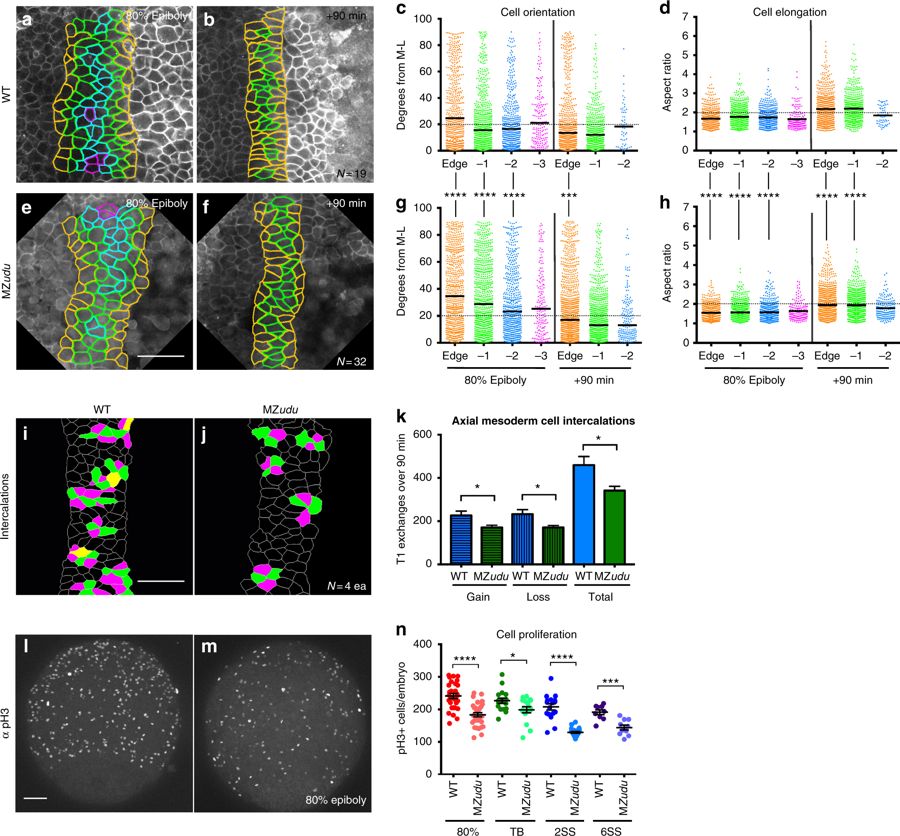
Mediolateral cell polarity and cell intercalations are reduced in the axial mesoderm of MZudu−/− gastrulae. a–b, e–f Still images from live time-lapse confocal movies of the axial mesoderm in WT (a, b) and MZudu−/− (e, f) gastrulae at the time points indicated. Cell outlines are colored according to a cell’s position with respect to the notochord boundary. c, g Quantification of axial mesoderm cell orientation at 80% epiboly (left side) and +90 min (right side) time points. Each dot represents the orientation of the major axis of a single cell with respect to the embryonic ML axis and is colored according to that cell’s position with respect to the notochord boundary (as in images to the left). Bars indicate median values. Asterisks indicate significant differences between WT and MZudu−/− (Kolmogorov–Smirnov test, ***p < 0.001, ****p < 0.0001). d, h Quantification of axial mesoderm cell elongation at 80% epiboly (left side) and +90 min (right side) time points. Each dot represents the aspect ratio of a single cell and is color-coded as in c. Bars indicate mean values. Asterisks indicate significant differences between WT and MZudu−/− (Mann–Whitney test, ****p < 0.0001). i–j Cell intercalations detected in the axial mesoderm of WT (i) and MZudu−/− gastrulae (j). Cells gaining contacts with neighbors are green, cells losing contacts are magenta, and cells that both gain and lose contacts are yellow. k Quantification of cell intercalation events (T1 exchanges) in WT (blue bars) and MZudu−/− gastrulae (green bars) over 90 min. N indicates the number of embryos analyzed. Bars are means with SEM (T-test, *p < 0.05). l–m 200 μm confocal Z projections of immunofluorescent staining for phosphorylated Histone H3 (pH3) in WT (l) and MZudu−/− gastrulae (m) at 80% epiboly. Images are representative of eight independent trials. n Quantification of pH3+ cells/embryo at the stages indicated. Each dot represents a single embryo, dark lines are means with SEM (T-test, *p < 0.05, ***p < 0.001, ****p < 0.0001). Scale bars are 50 μm. Anterior/animal pole is up in all images