
Fig. 2
- ID
- ZDB-IMAGE-180705-49
- Antibodies
- Publication
- Williams et al., 2018 - Gon4l regulates notochord boundary formation and cell polarity underlying axis extension by repressing adhesion genes
- All Figures
- Figures for Williams et al., 2018
|
Fig. 2
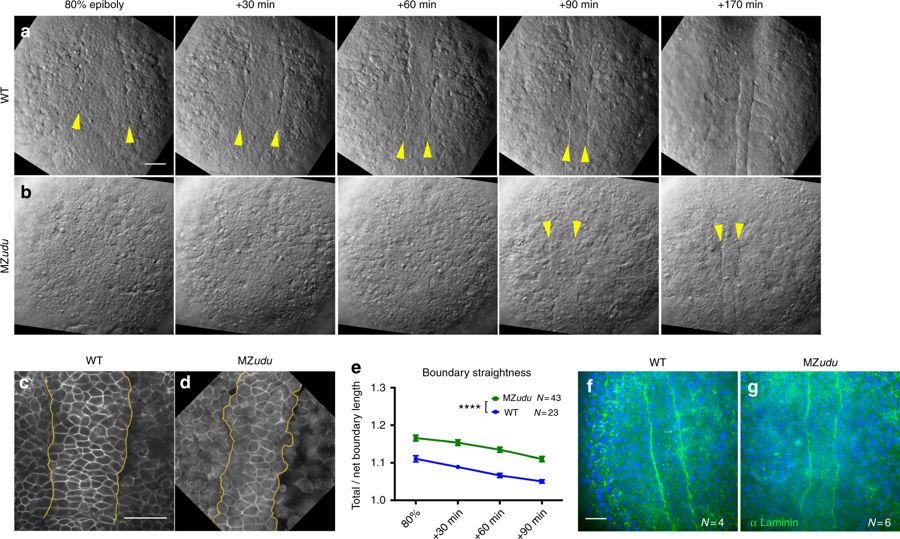
MZudu mutant gastrulae exhibit irregular notochord boundaries. a–b Still images from live Nomarski time-lapse series of the dorsal mesoderm in WT (a) and MZudu−/− embryos (b) at the time points indicated. Images are representative of over 40 MZudu−/− gastrulae. Arrowheads indicate notochord boundaries. c–d Live confocal microscope images of representative WT (c, N = 23) and MZudu−/− (d, N = 43) embryos expressing membrane Cherry. Yellow lines mark notochord boundaries. e Quantification of notochord boundary straightness in live WT and MZudu−/− gastrulae throughout gastrulation. Symbols are means with SEM (two-way ANOVA, ****p < 0.0001). f–g Confocal microscope images of immunofluorescent staining for pan-Laminin in WT (f) and MZudu−/− (g) embryos at two-somite stage. N indicates the number of embryos analyzed. Scale bars are 50 μm. Anterior is up in all images