
Fig. 4
- ID
- ZDB-IMAGE-180620-4
- Genes
- Publication
- Gou et al., 2018 - sox2 and sox3 play unique roles in development of hair cells and neurons in the zebrafish inner ear
- All Figures
- Figures for Gou et al., 2018
|
Fig. 4
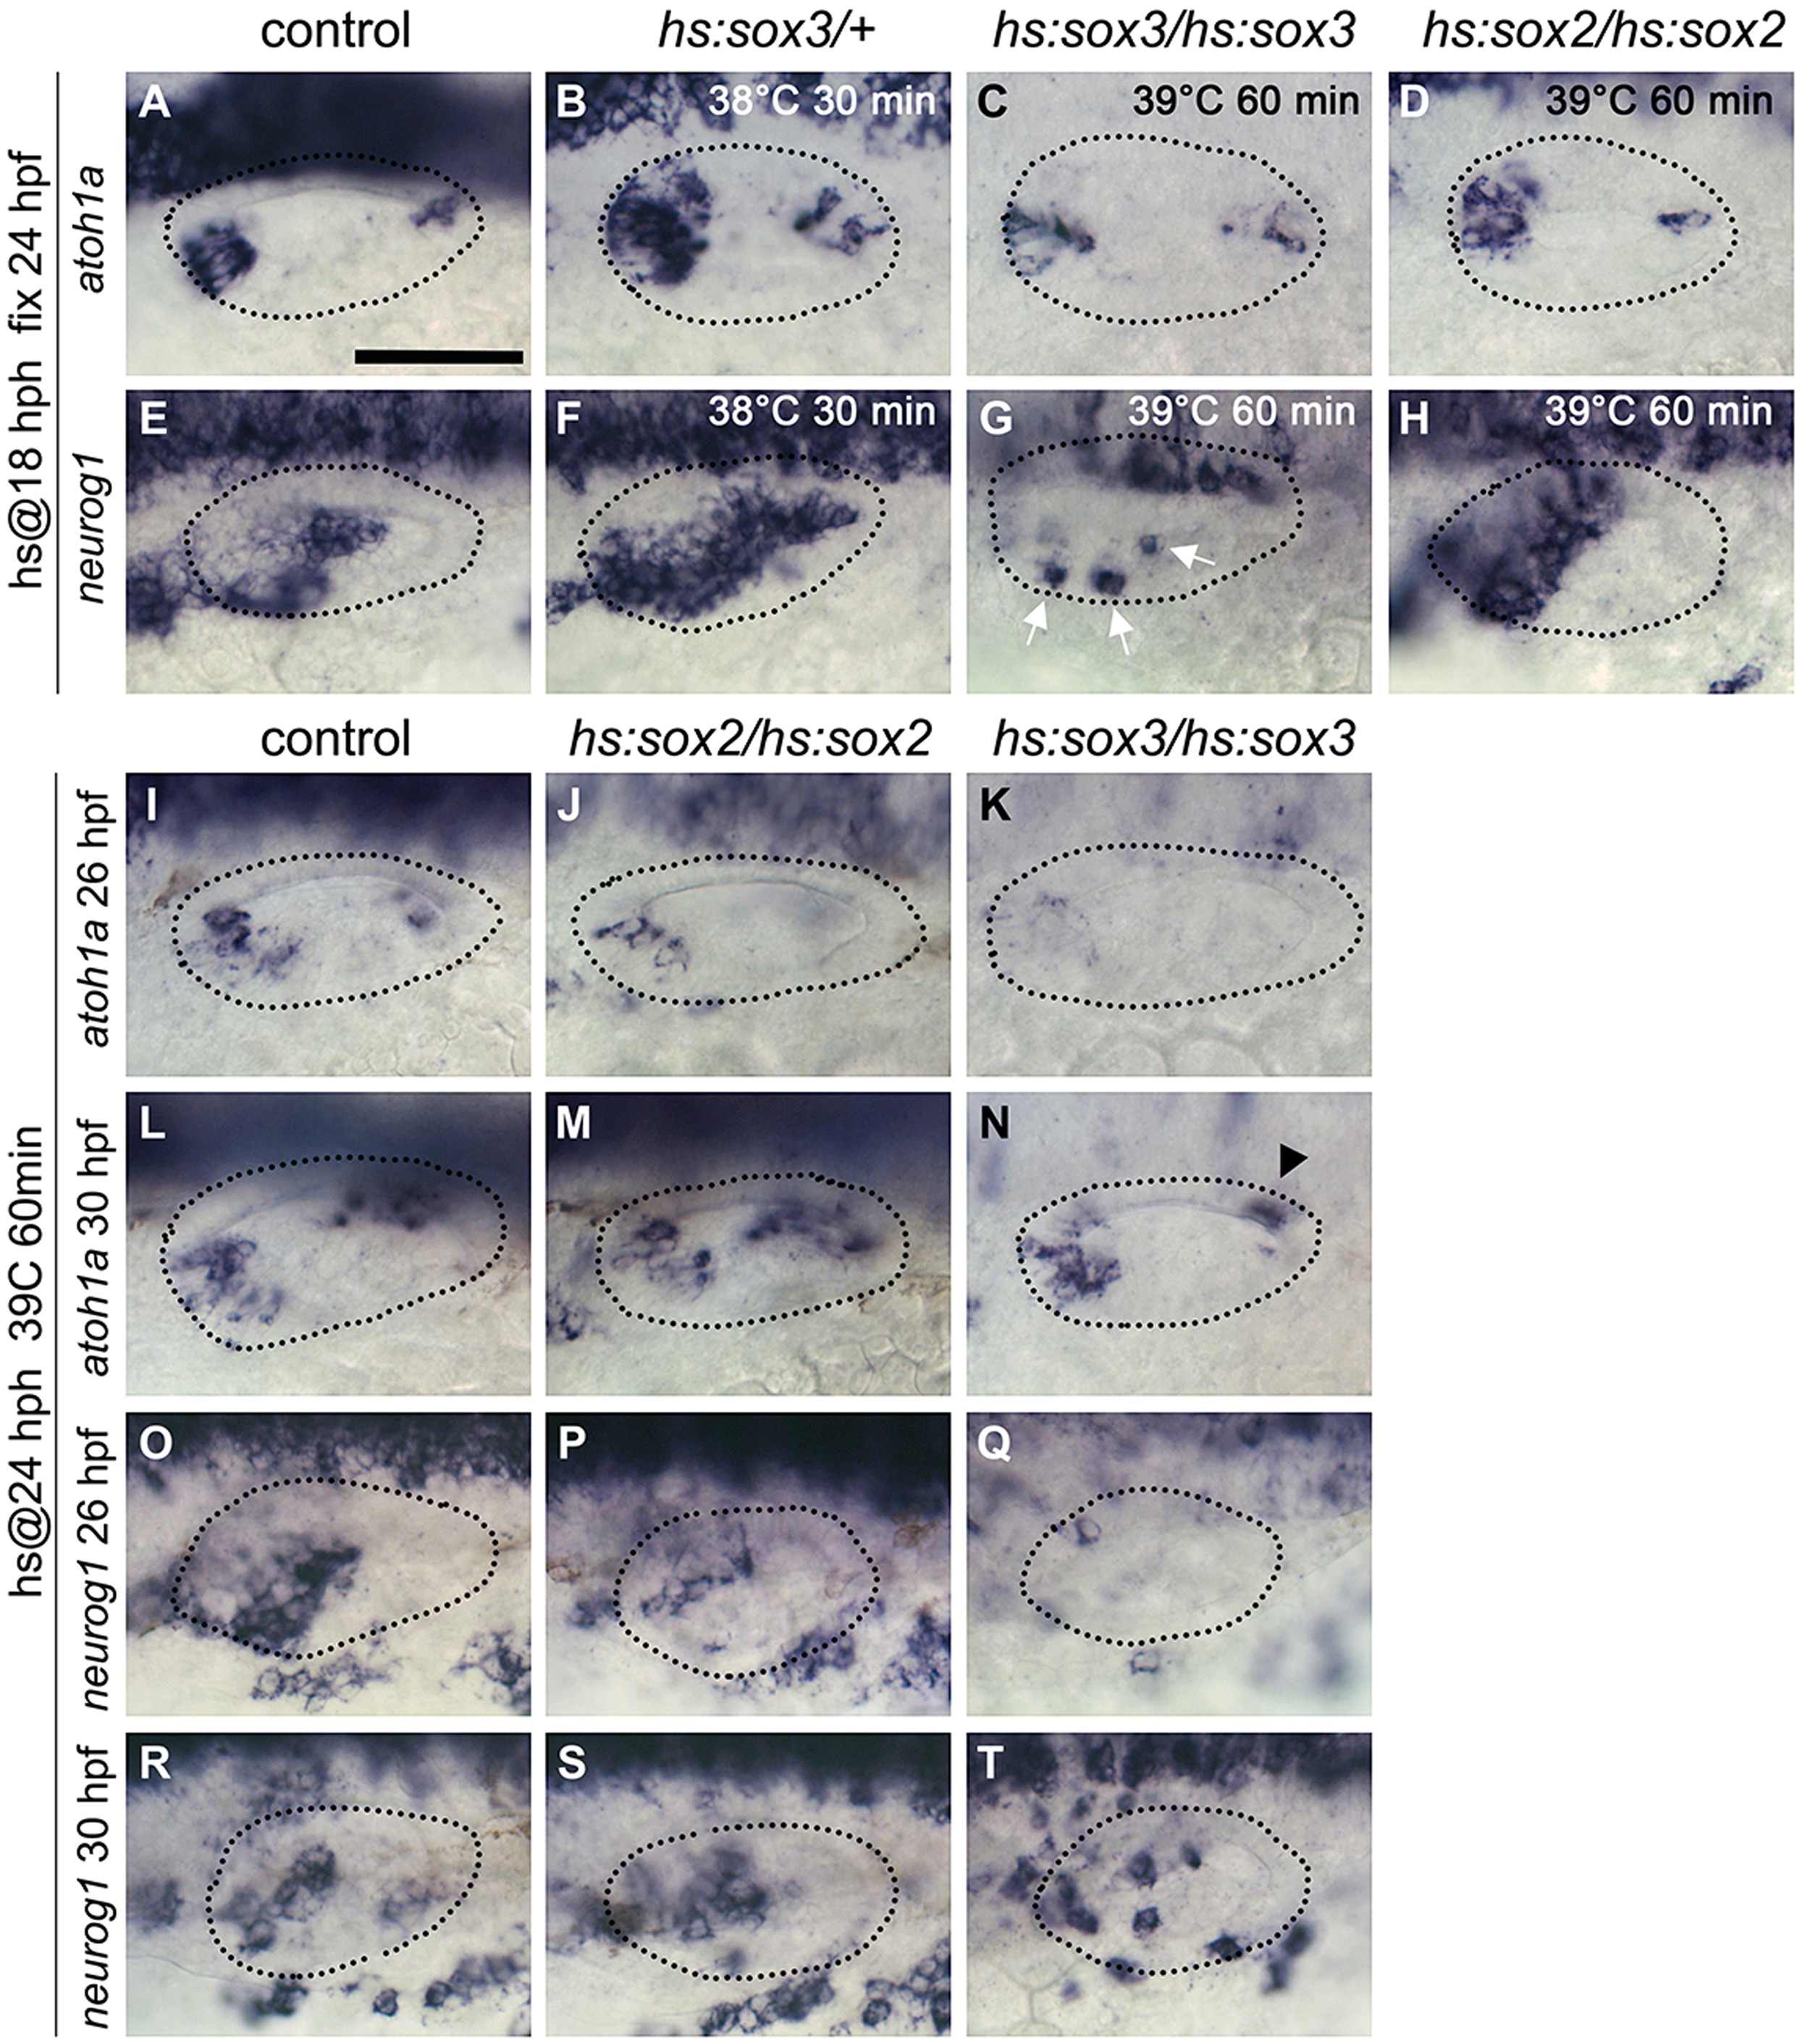
Effects of misexpressingsox2orsox3at later stages. (A–H) Expression of atoh1a (A–D) and neurog1 (E–H) at 24 hpf in control (A, E), hs:sox3/+ (B, F), hs:sox3/hs:sox3 (C, G) and hs:sox2/hs:sox2 (D, H) embryos. Embryos were heat-shocked at 18 hpf with varying temperatures and durations as indicated. White arrows indicate otic expression of neurog1 in G. (I–N) Expression of atoh1a at 26 hpf (I–K) and 30 hpf (L–N) in control (I, L), hs:sox2/hs:sox2 (J, M) and hs:sox3/hs:sox3 (K, N) embryos following heat-shock (39 °C for 60 min) at 24 hpf. Black arrowhead indicates atoh1a expression in the saccular macula in N, which is strongly reduced compare to L. (O–T) Expression of neurog1 at 26 hpf (O–Q) and 30 hpf (R–T) in control (O, R), hs:sox2/hs:sox2 (P, S) and hs:sox3/hs:sox3 (Q, T) embryos following heat-shock (39 °C, 60 min) at 24 hpf. All images show dorsolateral views (anterior to the left) and otic vesicle borders are outlined.
Reprinted from Developmental Biology, 435(1), Gou, Y., Vemaraju, S., Sweet, E.M., Kwon, H.J., Riley, B.B., sox2 and sox3 play unique roles in development of hair cells and neurons in the zebrafish inner ear, 73-83, Copyright (2018) with permission from Elsevier. Full text @ Dev. Biol.