
IMAGE
Fig. 4-S1
- ID
- ZDB-IMAGE-180611-74
- Genes
- Publication
- Burkhard et al., 2018 - Spatially resolved RNA-sequencing of the embryonic heart identifies a role for Wnt/β-catenin signaling in autonomic control of heart rate
- All Figures
- Figures for Burkhard et al., 2018
Image
|
Figure Caption
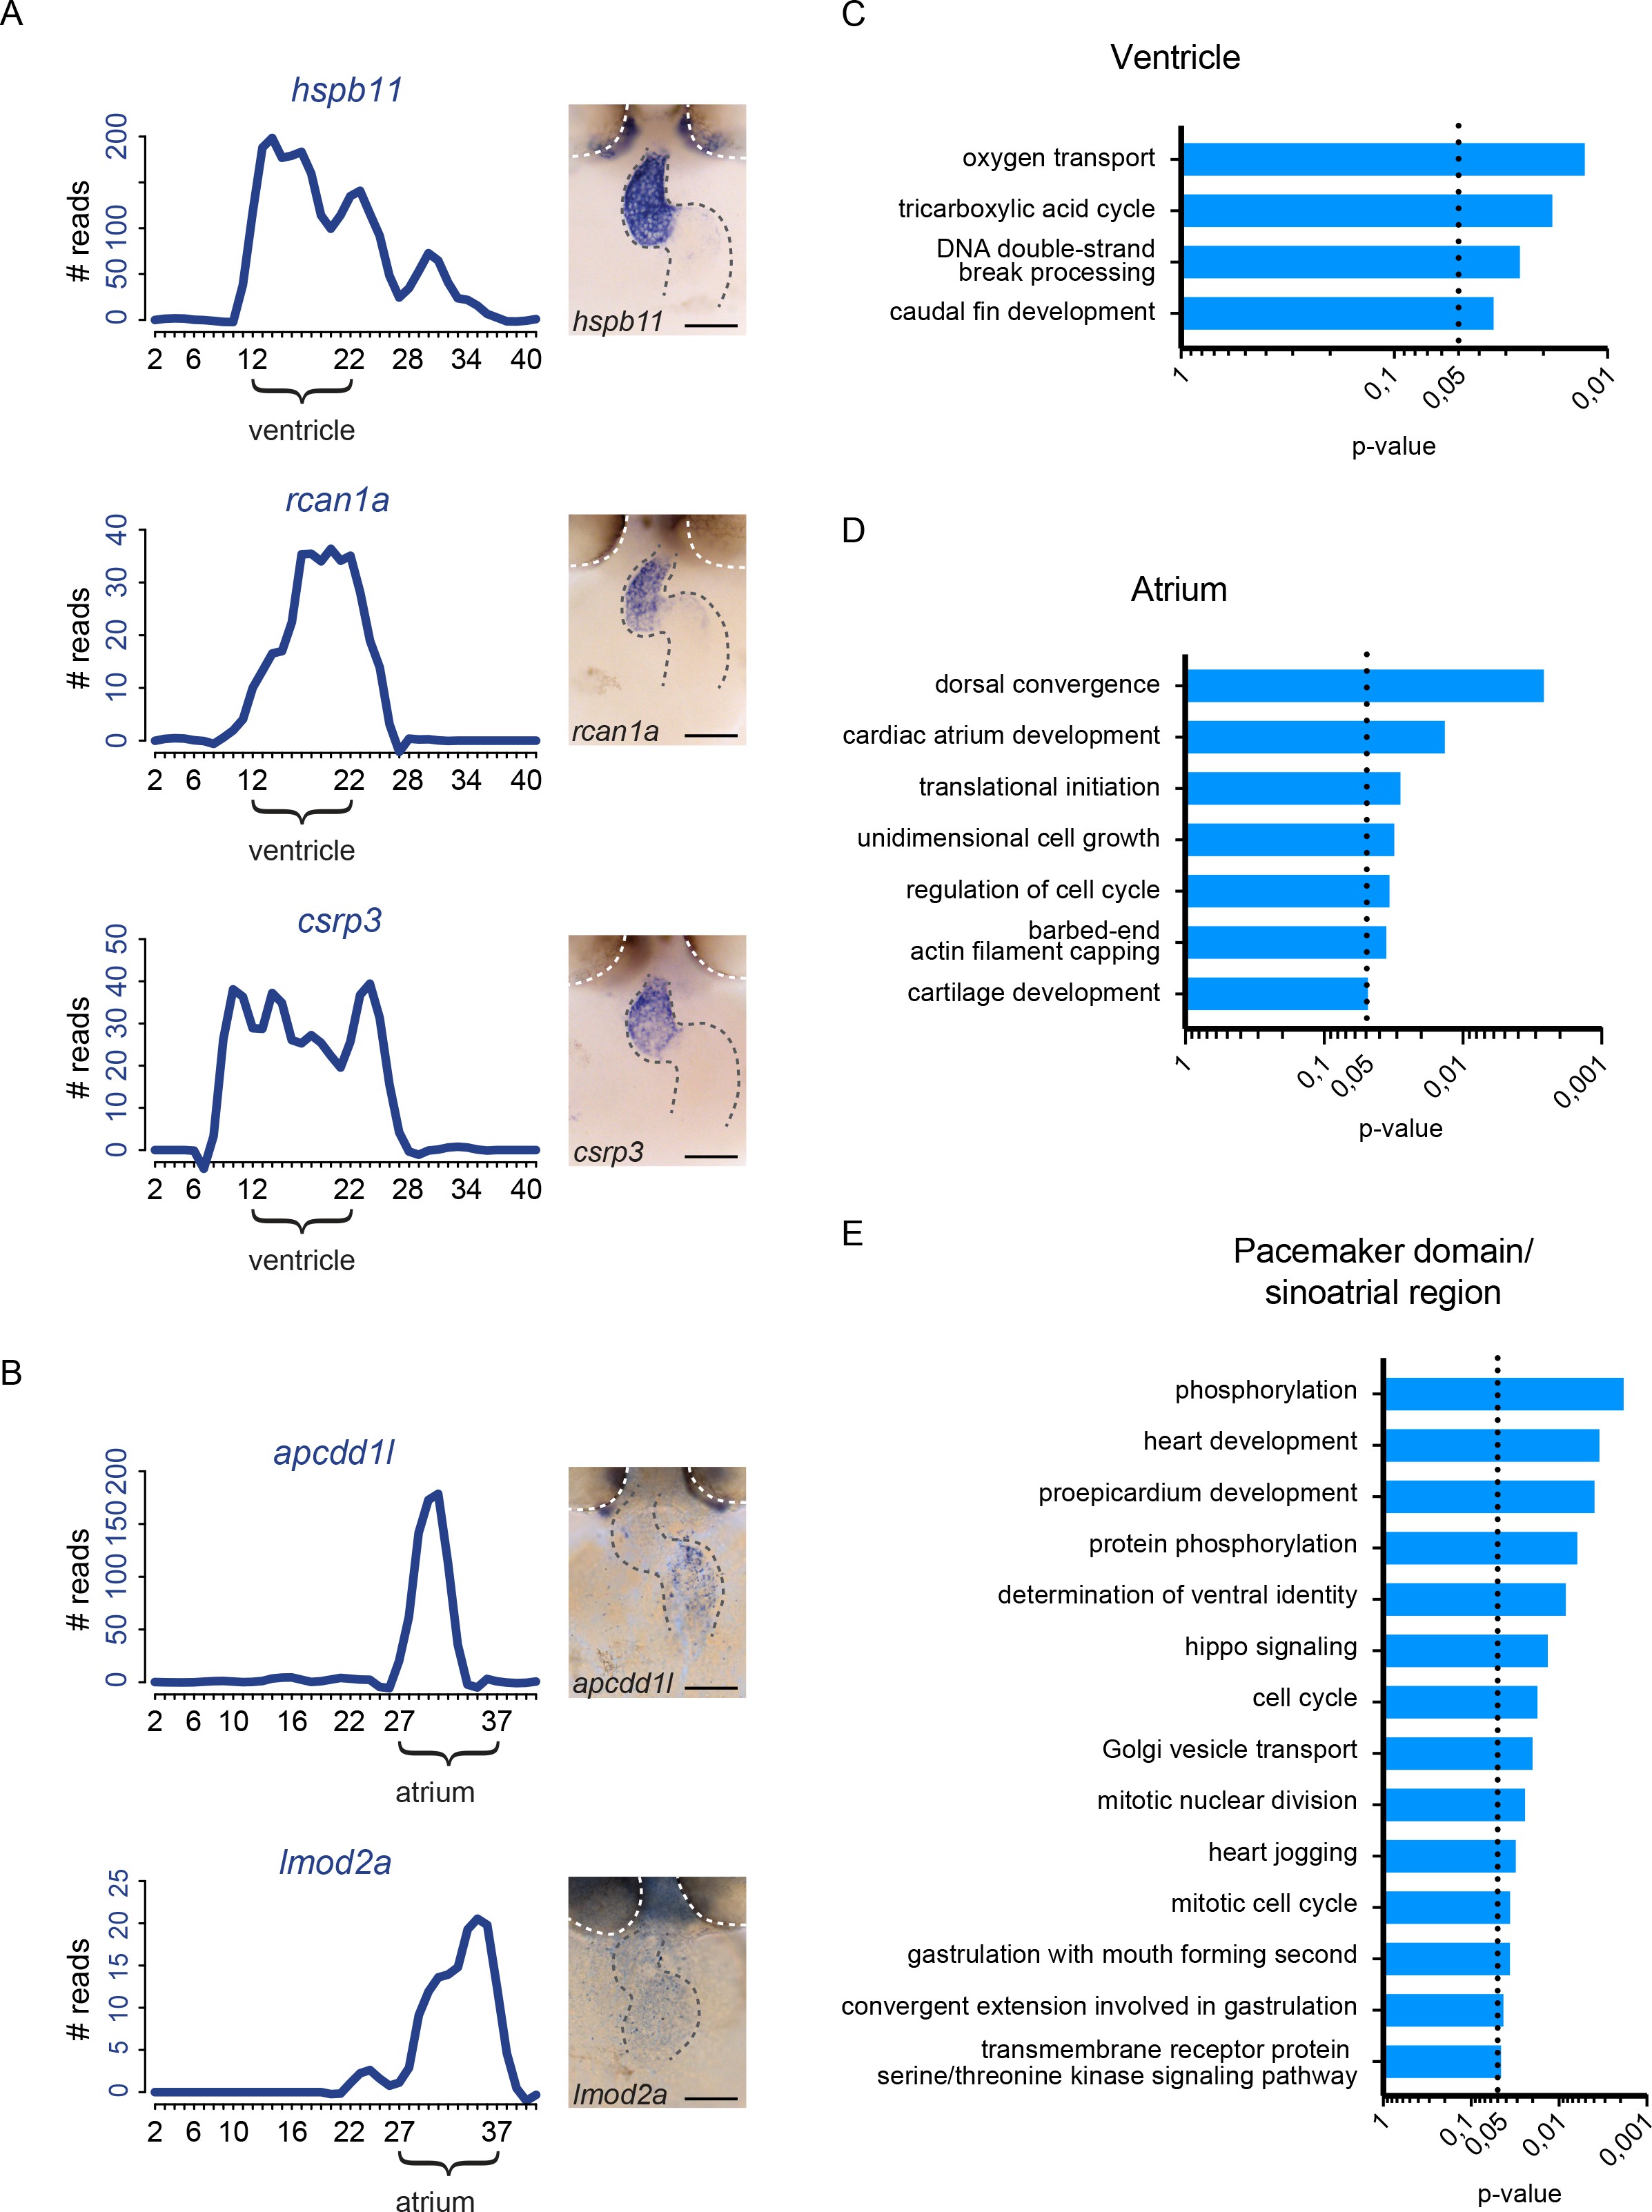
Fig. 4-S1
Identification of region-specific gene expression patterns.
(A–B) Additional gene expression plot and ISH analysis for representative example genes significantly upregulated in the ventricle (hspb11, rcan1a, csrp3) and atrium (apcdd1l, lmod2a). Gray dashed line: location of the heart. White dashed line outlines the eyes. Anterior to the top. (C–E) GO term enrichment for genes significantly enriched in the ventricle (C), atrium (D) and pacemaker domain (E). Smoothening (LOESS) was applied to graphs A and B, span α = 0.2. p-value<0.05. Scale bars represent 50 μm.
Figure Data
Acknowledgments
This image is the copyrighted work of the attributed author or publisher, and
ZFIN has permission only to display this image to its users.
Additional permissions should be obtained from the applicable author or publisher of the image.
Full text @ Elife