
Fig. 6
- ID
- ZDB-IMAGE-180109-12
- Publication
- Turrini et al., 2017 - Optical mapping of neuronal activity during seizures in zebrafish
- All Figures
- Figures for Turrini et al., 2017
|
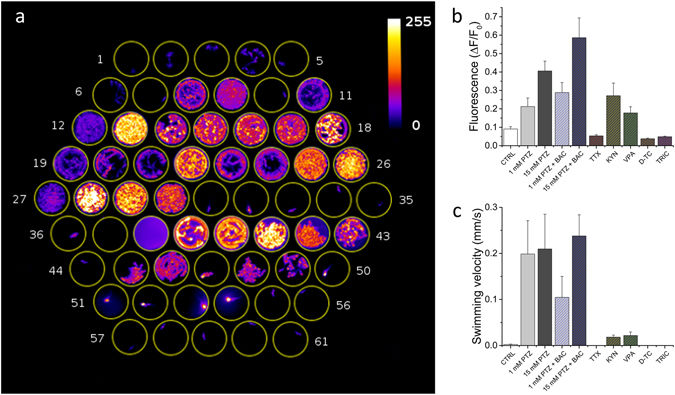
Fig. 6
High-throughput combined fluorescence and behavioural assay. (a) Maximum intensity projection of a 13 minute segment of the recording. Well content: 1–6 control, 7–12 1 mM PTZ, 13–18 15 mM PTZ, 19–24 1 mM PTZ + 50 μM Baclofen, 25–30 15 mM PTZ + 50 μM Baclofen, 31–36 15 mM PTZ + 5 μM Tetrodotoxin, 37 fish water, 38 fish water + 2 mM Kynurenate, 39–43 15 mM PTZ + 2 mM kynurenate, 44–49 15 mM PTZ + 5 mM Valproate, 50–55 15 mM PTZ (after pre-incubation in 2 mM d-tubocurarine for 10 minutes before starting the measurement), 56–61 15 mM PTZ + 160 mg/L Tricaine. (b) Average ΔF/F0 and (c) swimming velocity for the different conditions tested. Error bars: s.e.m.