
IMAGE
Fig. 5
- ID
- ZDB-IMAGE-171207-31
- Genes
- Publication
- Lu et al., 2015 - Direct regulation of p53 by miR-142a-3p mediates the survival of hematopoietic stem and progenitor cells in zebrafish
- All Figures
- Figures for Lu et al., 2015
Image
|
Figure Caption
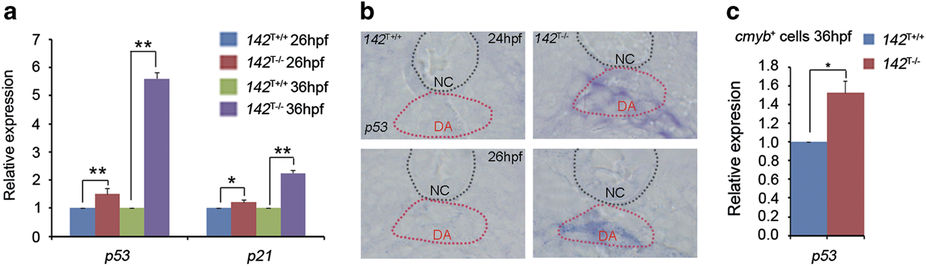
Fig. 5
142T−/− embryos display ectopic expression of p53. (a) The expression of p53 and p21 was increased in 142T−/− embryos at 26 and 36 hpf using qPCR (mean±s.d., n=3, *P<0.05, **P<0.01). (b) P53 was increased in the dorsal aorta region in 142T−/− embryos at 24 and 26 hpf by WISH. (c) The expression of p53 was increased in cmyb-positive cells in the trunk of 142T−/− embryos at 36hpf.
Figure Data
Acknowledgments
This image is the copyrighted work of the attributed author or publisher, and
ZFIN has permission only to display this image to its users.
Additional permissions should be obtained from the applicable author or publisher of the image.
Full text @ Cell Discov