
Fig. 1
- ID
- ZDB-IMAGE-171009-20
- Genes
- Publication
- Soman et al., 2017 - Inhibition of the mitochondrial calcium uniporter rescues dopaminergic neurons in pink1-/- zebrafish.
- All Figures
- Figures for Soman et al., 2017
|
Fig. 1
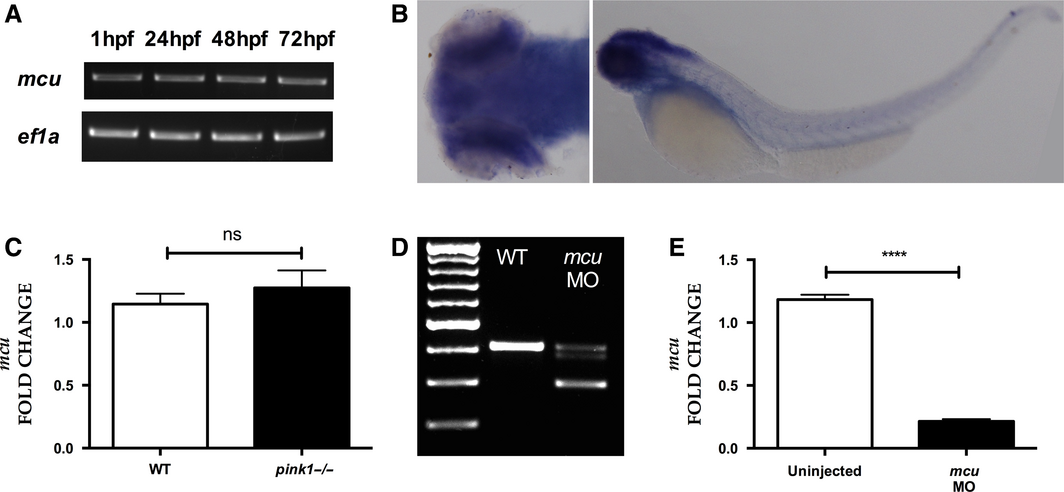
mcu expression. (A) RT-PCR analysis showing consistent expression of mcu throughout development (1, 24, 48 and 72 hpf). (B) In situ hybridization with dorsal (left) and lateral (right) views of mcu expression in 3 dpf zebrafish larvae, demonstrating strong expression in the brain. (C) Quantification of mcu mRNA at 3 dpf, demonstrating similar expression levels in wt and pink1−/−. (D) RT-PCR analysis of mcu knockdown using antisense morpholino (MO) at 3 dpf, demonstrating the marked effect of MO mediated mcu k/d on mcu wild type transcript levels. (E) Q-PCR based confirmation of marked effect of MO-mediated mcu k/d on mcu mRNA transcript levels (****P < 0.0001).