
Fig. 4
- ID
- ZDB-IMAGE-170208-12
- Genes
- Publication
- Bielczyk-Maczyńska et al., 2015 - The Ribosome Biogenesis Protein Nol9 Is Essential for Definitive Hematopoiesis and Pancreas Morphogenesis in Zebrafish
- All Figures
- Figures for Bielczyk-Maczyńska et al., 2015
|
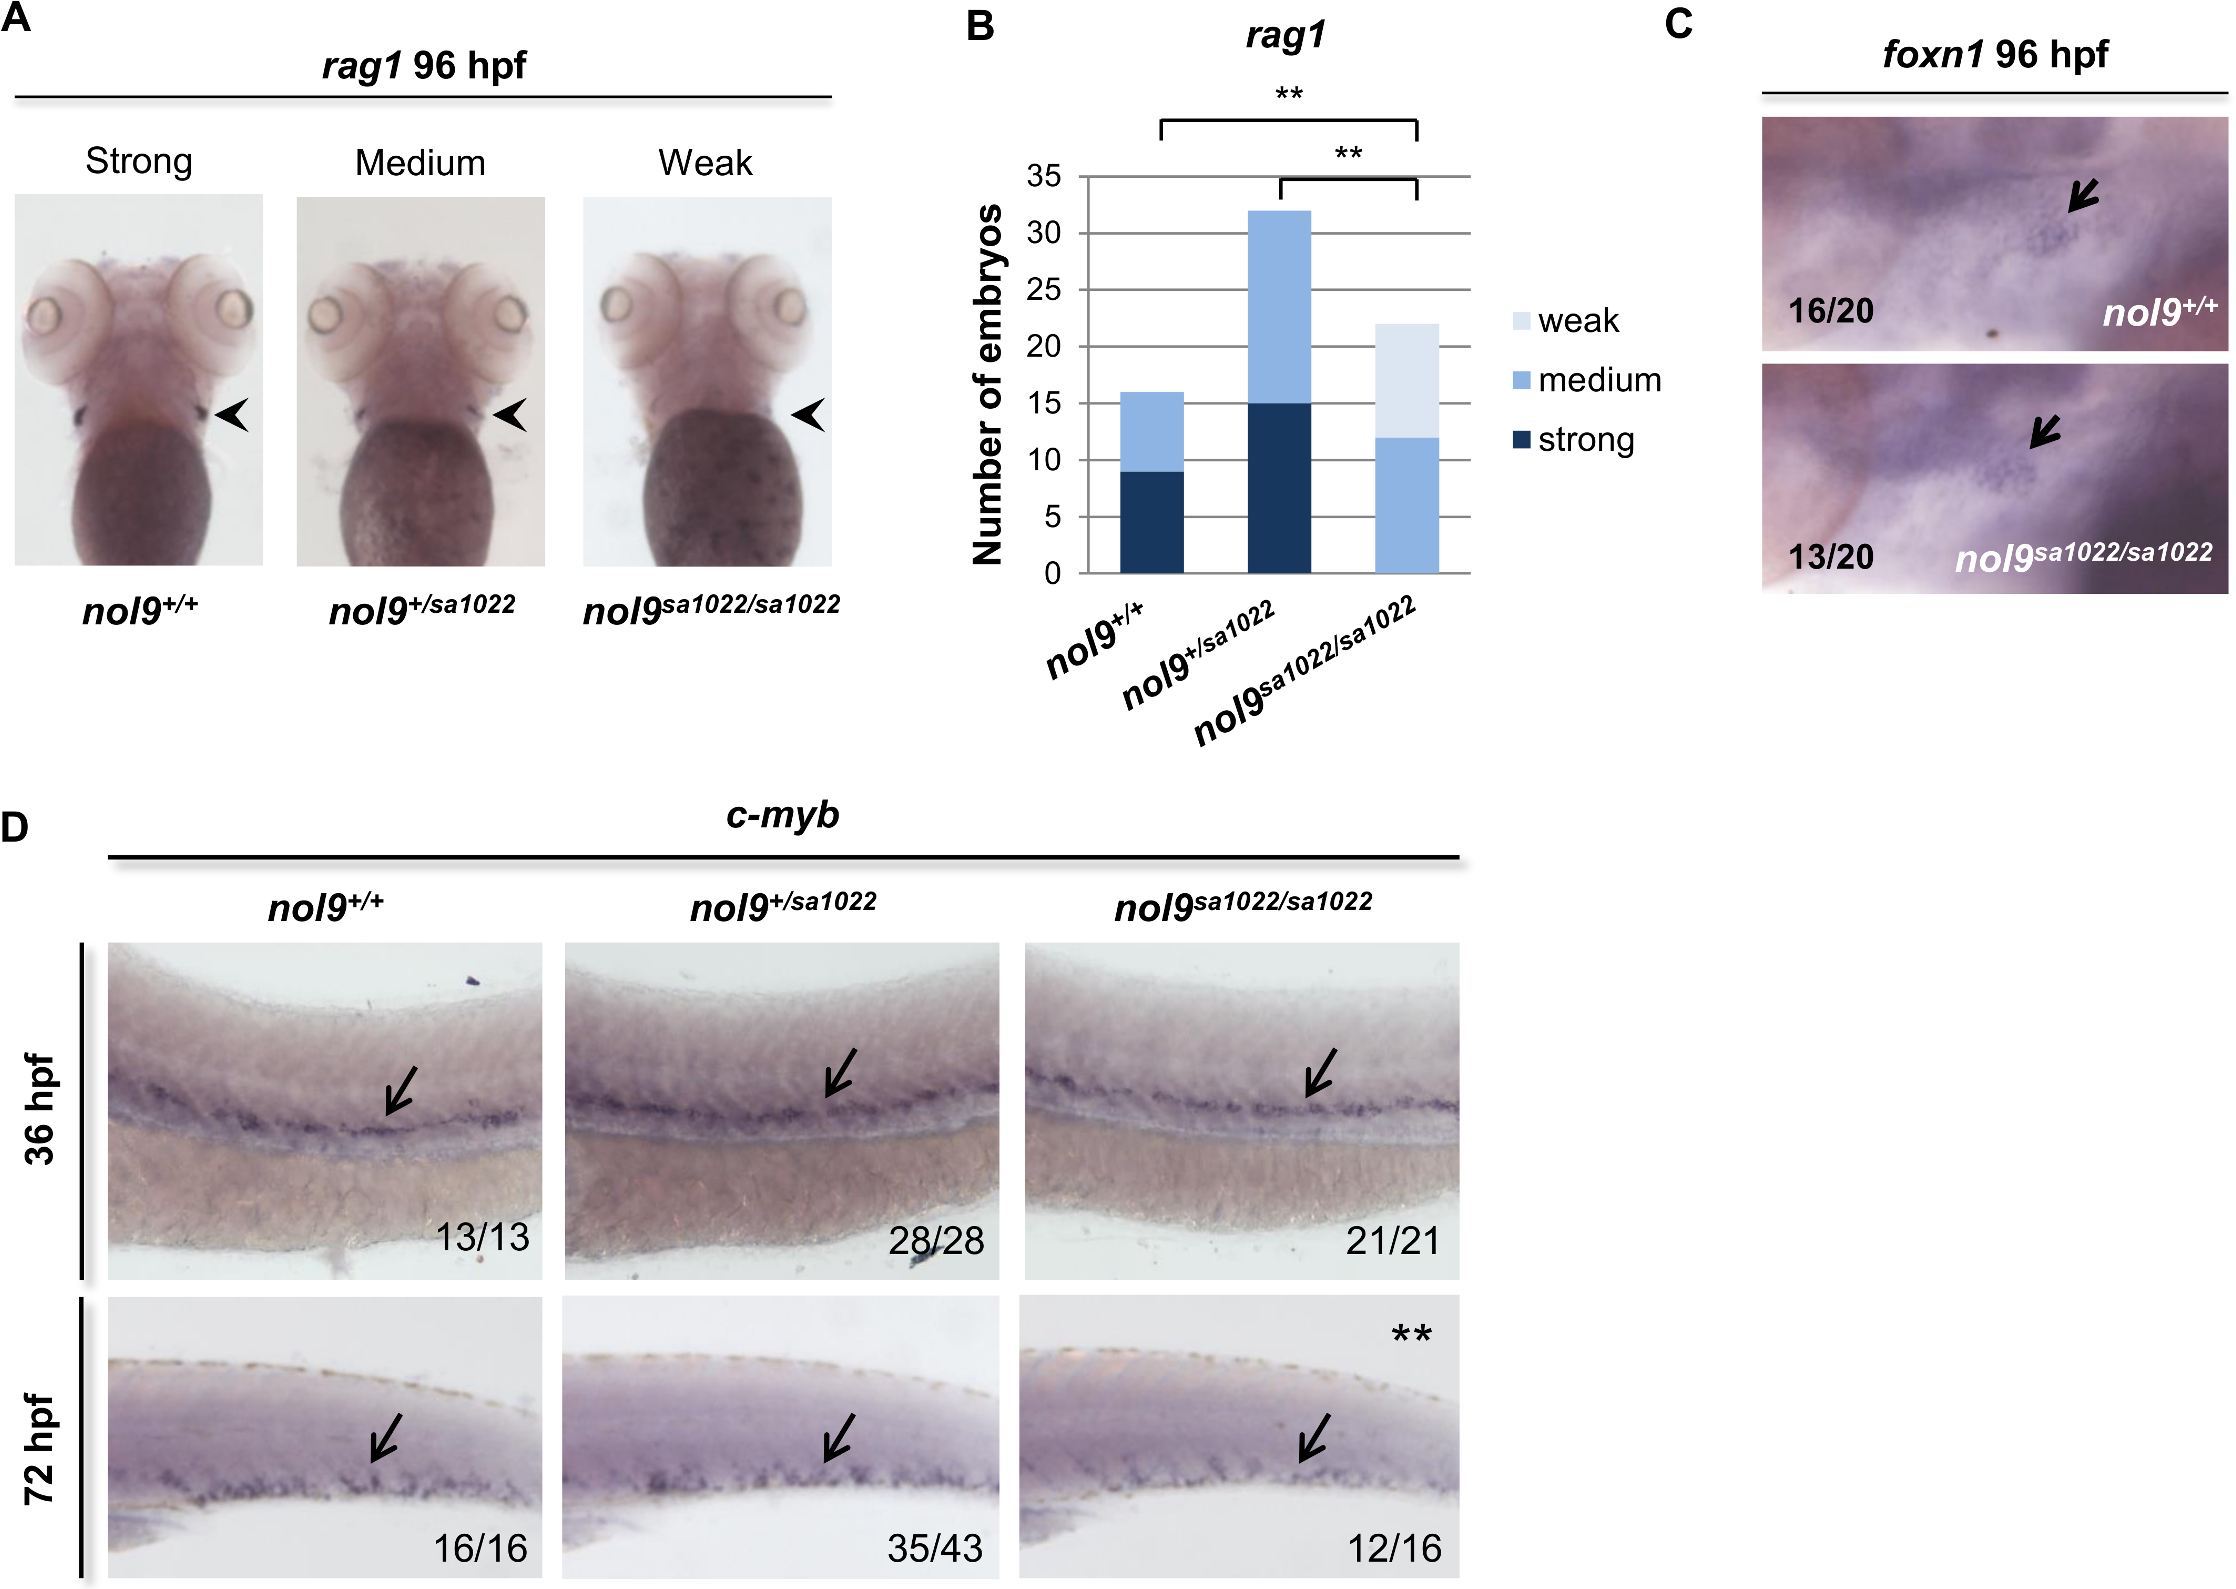
Fig. 4
nol9sa1022/sa1022 mutants show a decrease in the number of lymphocytes and HSPCs.
A) Whole-mount in situ hybridization with lymphocyte-specific rag1 probe (arrowhead) revealed that nol9sa1022/sa1022 larvae displayed weak to medium rag1 expression at 96 hpf, compared to medium to strong signal in nol9+/+ or nol9+/sa1022 siblings. Larvae are oriented anterior to the top and ventral up. (B) The number of larvae displaying different degrees of rag1 expression as assessed by WISH. Data are represented as the number of larvae belonging to each phenotypic group. Fisher’s exact test, ** p<0.01. (C) Whole-mount in situ hybridization against the thymic epithelium marker foxn1 at 96 hpf revealed a similar level of signal (arrow) in nol9+/+ and nol9sa1022/sa1022 siblings. (D) Whole-mount in situ hybridization using a c-myb riboprobe was used to assess the number of HSCs emerging in the AGM region at 36 hpf (arrow) and the number of HSPCs in the CHT (arrow) at 72 hpf. Representative pictures of the AGM region (36 hpf) and the CHT (72 hpf) are shown. Mutant nol9sa1022/sa1022 embryos displayed normal c-myb signal at 36 hpf and decreased c-myb signal at 72 hpf compared to wt siblings. Fisher’s exact test, **, p<0.01. All embryos are oriented with anterior to the left and dorsal to the top. Numbers represent embryos with the displayed phenotype out of the total number of embryos examined.