
IMAGE
Fig. S1
Image
|
Figure Caption
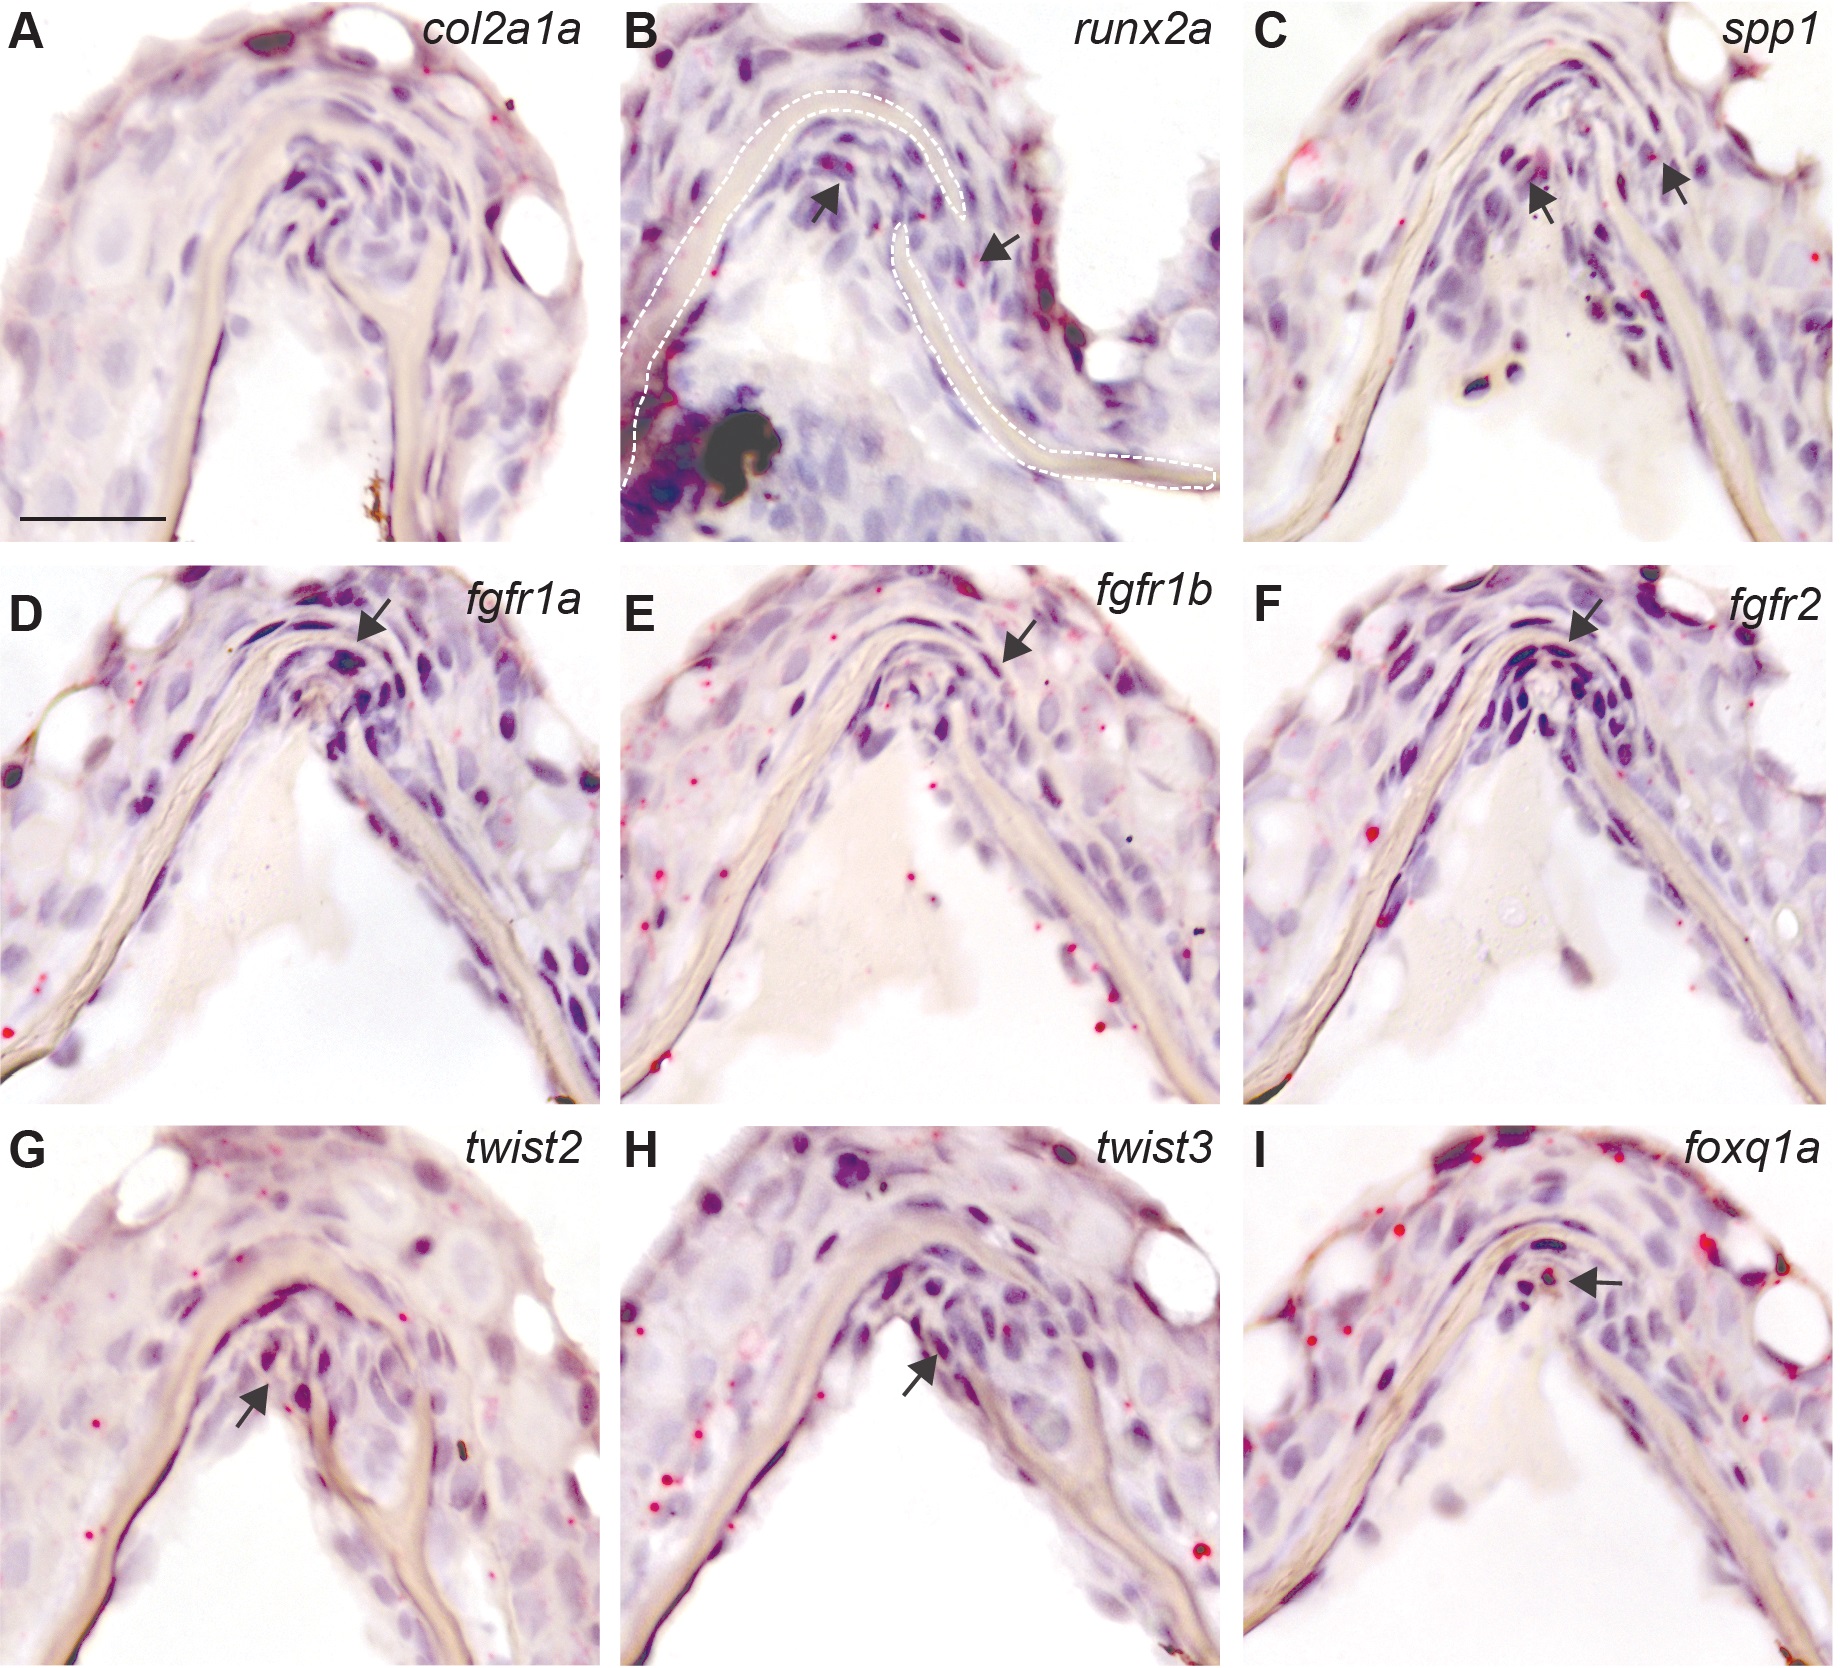
Fig. S1
RNA detection for genetic markers of osteoblasts in juvenile animals assessed using RNAscope in situ hybridization on paraffin section.
(A-I) Sequential sections (4 μm) of the interfrontal suture collected from juvenile zebrafish at age of 6 wpf. The expression of individual genes is visualized in red, counterstained with haematoxylin for nuclei in purple; black arrows indicate assumed positive expression. The expression of following genes is shown: (A) col2a1a, (B) runx2a, (C) spp1, (D) fgfr1a, (E) fgfr1b, (F) fgfr2, (G) twist2, (H) twist3, (I) foxq1a. The scale bar represents 20 μm.
Figure Data
Acknowledgments
This image is the copyrighted work of the attributed author or publisher, and
ZFIN has permission only to display this image to its users.
Additional permissions should be obtained from the applicable author or publisher of the image.
Full text @ PLoS One