
Fig. 2
- ID
- ZDB-IMAGE-161104-10
- Genes
- Publication
- Pi-Roig et al., 2014 - Distinct tissue-specific requirements for the zebrafish tbx5 genes during heart, retina and pectoral fin development
- All Figures
- Figures for Pi-Roig et al., 2014
|
Fig. 2
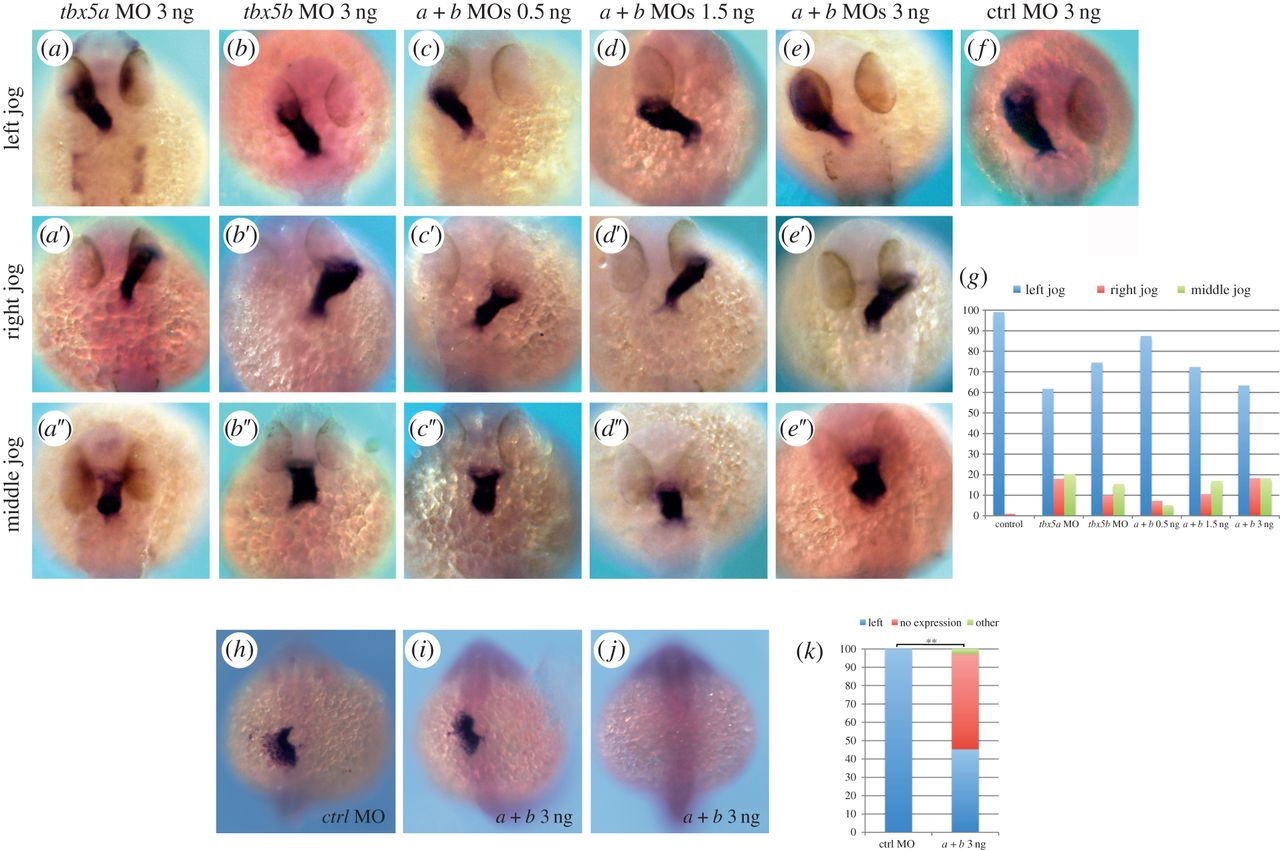
tbx5 morphants exhibit cardiac jogging and lefty2 expression defects. (a-a′′) tbx5a morphant phenotypes. (b-b′′) tbx5b morphants. (c-e′′) Left, right and middle jog phenotypes obtained by co-injection of tbx5a and tbx5b MOs at 0.5 ng (c-c′′), 1.5 ng (d-d′′) or 3 ng (e-e′′) of each MO. (f) Control (ctrl) morphant. (g) Quantification of the phenotypes. (h-j) lefty2 expression in control (h) and double-morphant (i,j) 22-somite stage embryos. (k) Quantification of the phenotypes. A χ2 test has been used to assess significant differences between groups (**p < 0.001). All images are dorsal views with anterior to the top, and myl7 expression is used to highlight the developing heart tube in a-f.