
Fig. 2
- ID
- ZDB-IMAGE-161028-21
- Genes
- Publication
- Warga et al., 2016 - Progressive loss of RacGAP1/ogre activity has sequential effects on cytokinesis and zebrafish development
- All Figures
- Figures for Warga et al., 2016
|
Fig. 2
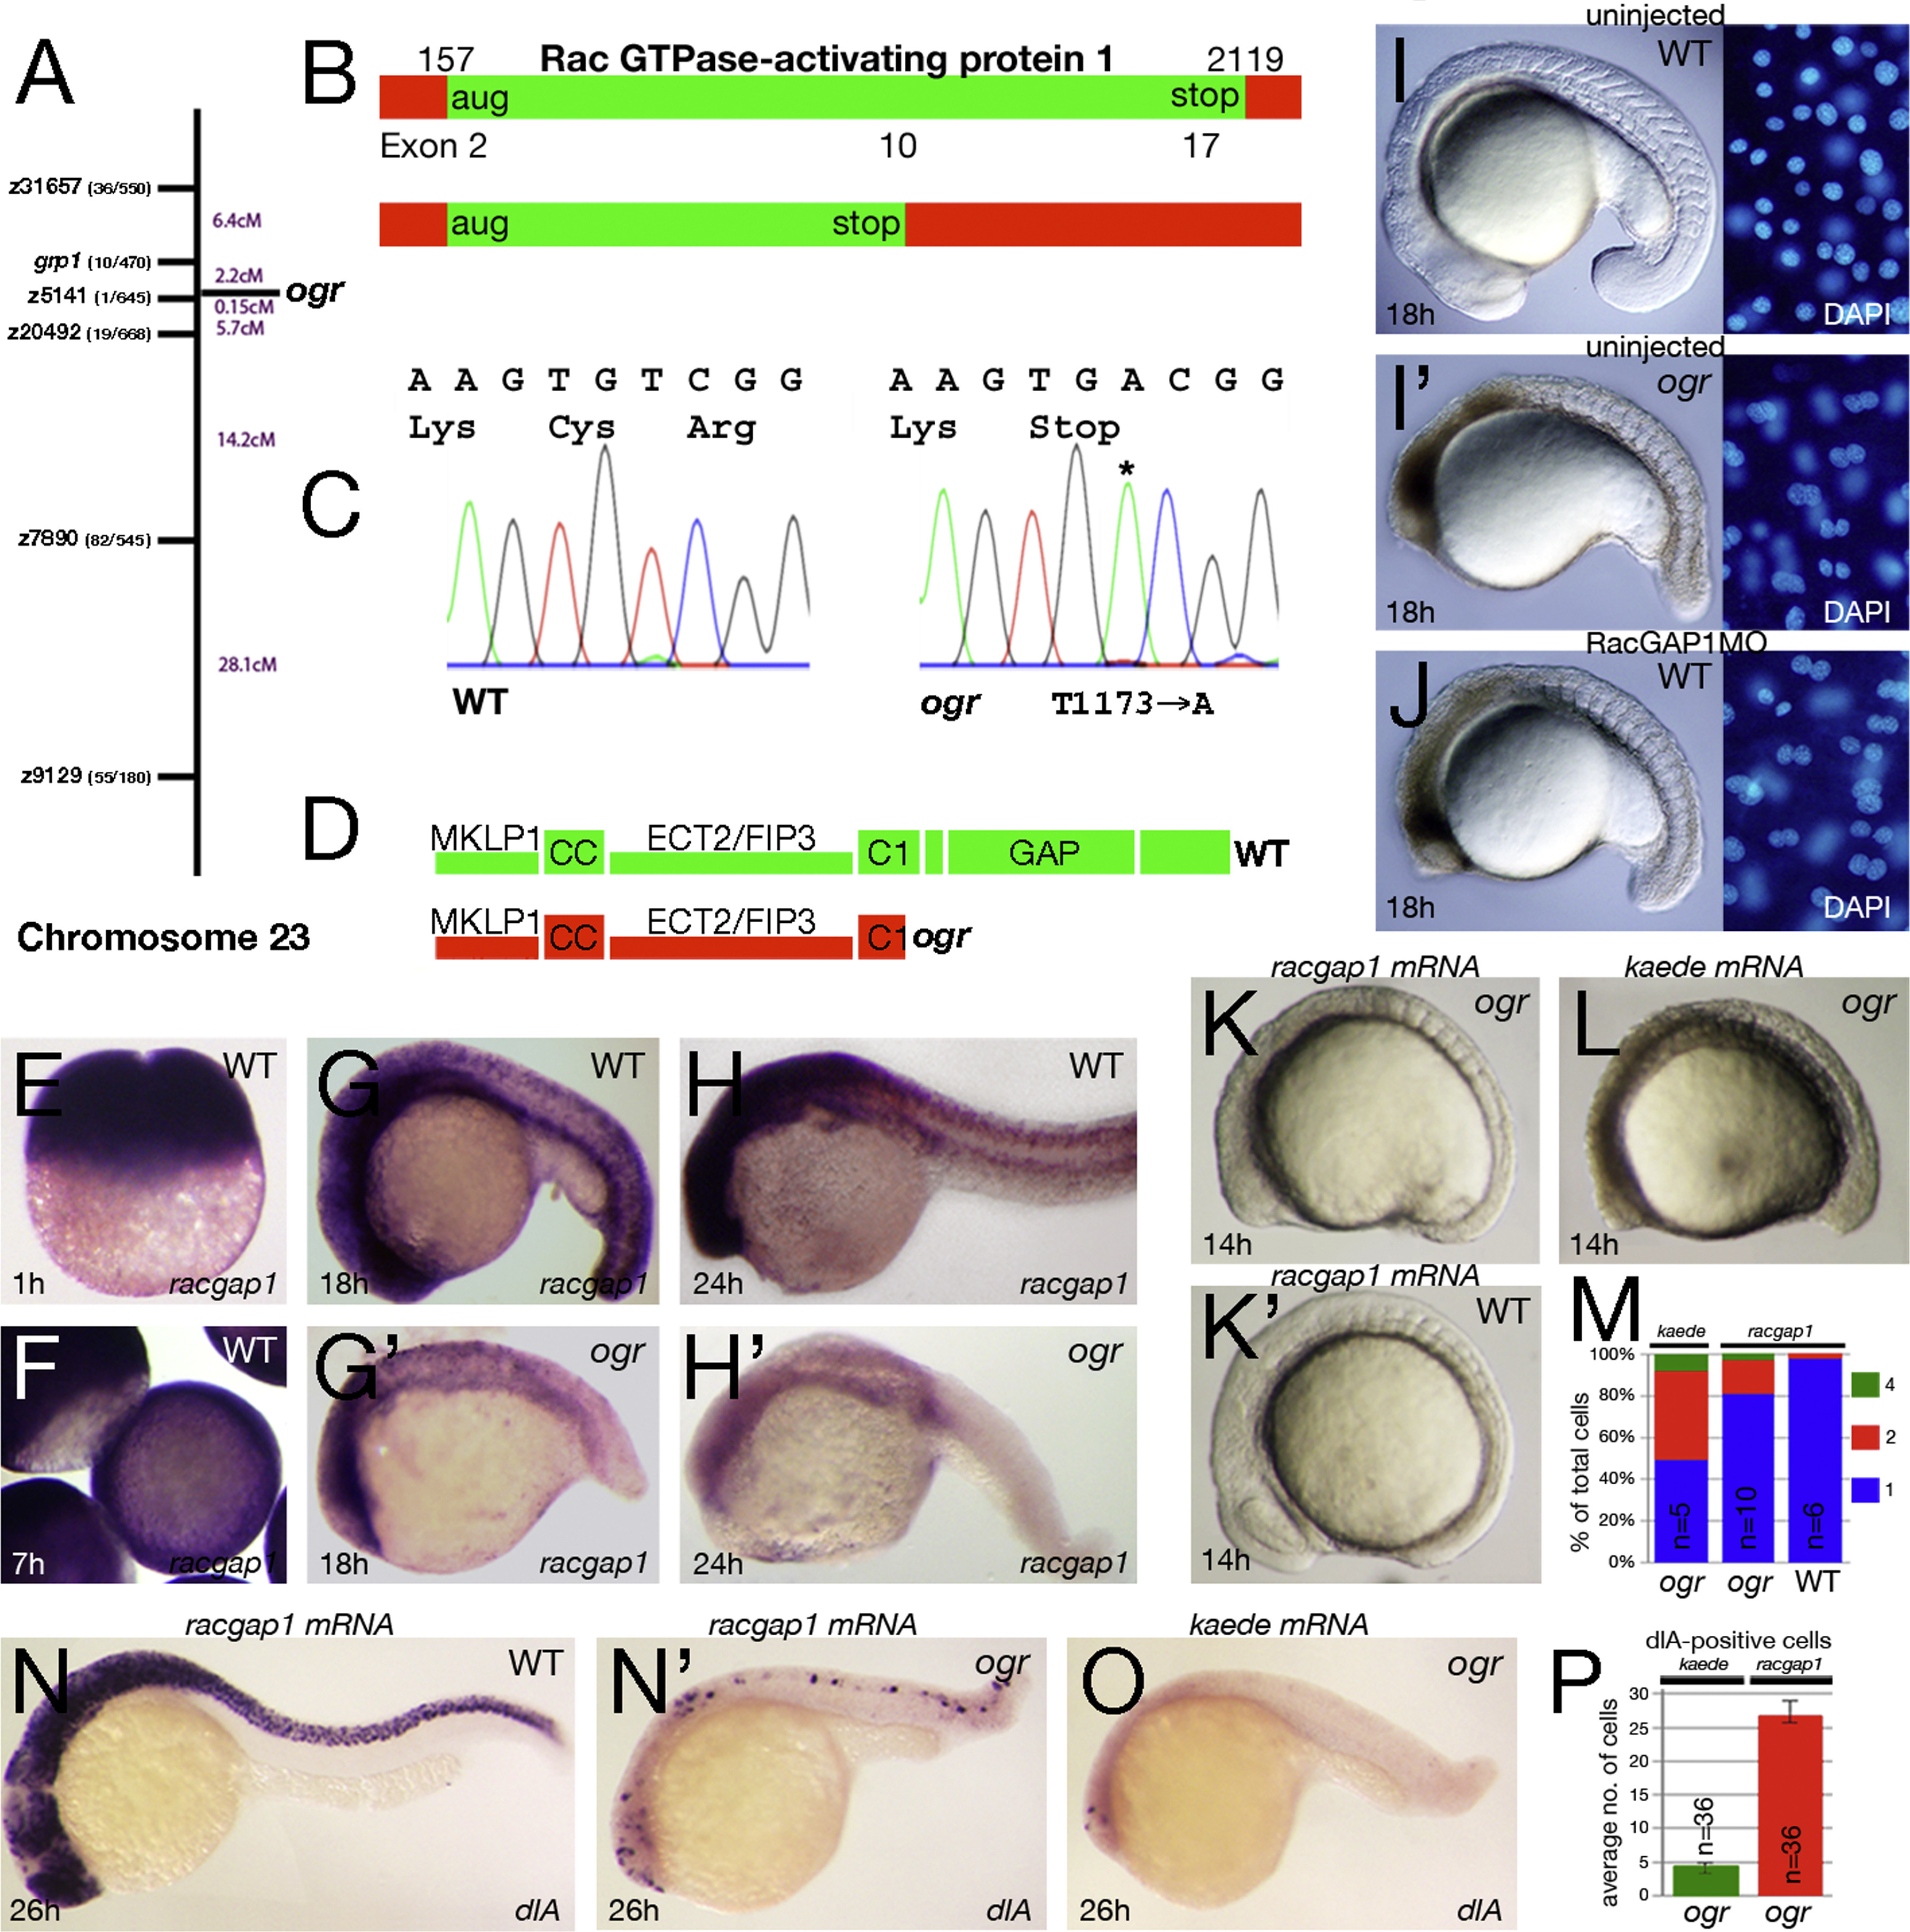
ogre is a mutation in racgap1. (A) Genetic map of chromosome 23 showing number of recombinants and calculated distance for microsatellite markers and genes. (B) Schematic of the racgap1 cDNA showing location of termination codon in exon 10 and (C) sequence trace data. (D) Schematic of the RacGAP1 protein. MKLP1 binding region; CC, coiled-coiled domain; ECT2/FIP3 binding region; C1, atypical C1 domain; GAP, GTPase-activating domain. (E-H) Expression of racgap1 mRNA: (E) maternal expression at 1 h; and (F-H) zygotic expression at: (F) 7 h; (G) 18 h; and (H) 24 h. (I-J) Anti-sense knockdown of racgap1 mRNA by morpholino (MO) phenocopies ogre; left side: embryo, right side: DAPI-stained nuclei. (K-P) racgap1 mRNA rescues the ogre mutant phenotype. (K) racgap1 injected and (L) kaede control embryos. (M) Quantification of multinucleate cells at 10-somites. Differences between kaede and racgap1 injected mutant embryos are significantly different (p<0.01, Wilcoxon rank sum); racgap1 injected wild type and mutant embryos are also significantly different (p<0.01, Wilcoxon rank sum). (N-P) dlA expression in neuroblasts: (N) racgap1 injected and (O) kaede control embryos and (P) their average number in ogre mutants.
Reprinted from Developmental Biology, 418(2), Warga, R.M., Wicklund, A., Richards, S.E., Kane, D.A., Progressive loss of RacGAP1/ogre activity has sequential effects on cytokinesis and zebrafish development, 307-22, Copyright (2016) with permission from Elsevier. Full text @ Dev. Biol.