
|
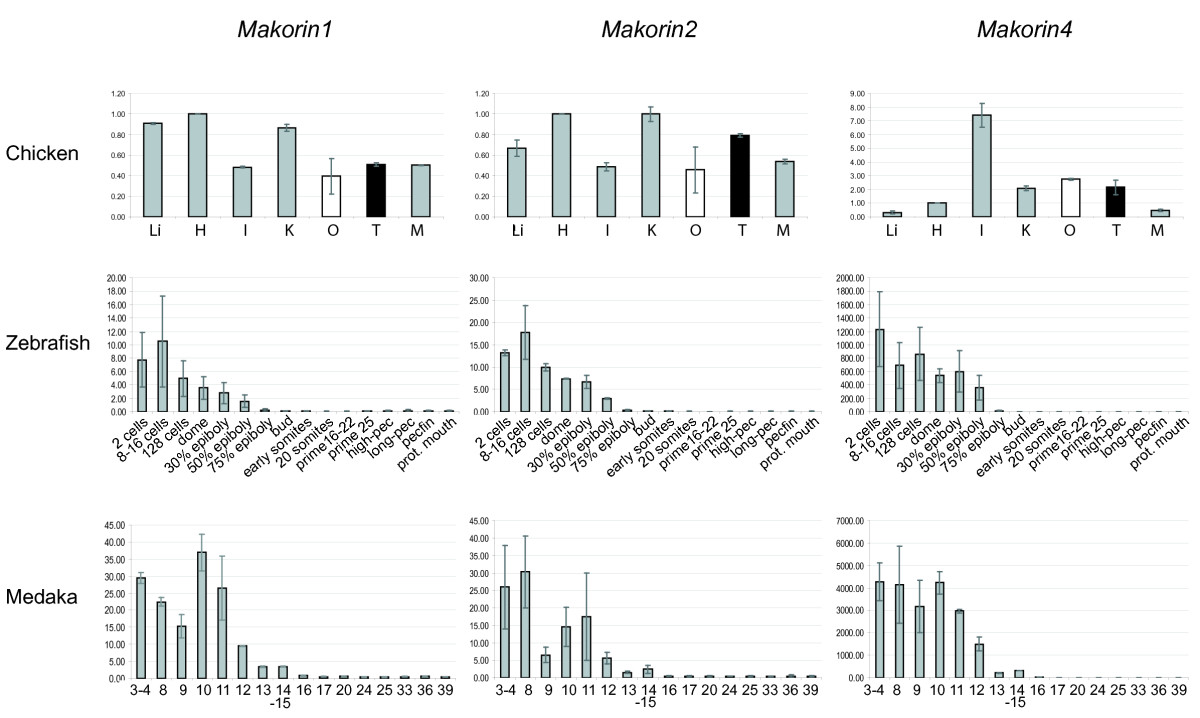
Fig. 6
RT-qPCR expression analysis of makorin genes in vertebrate embryos and embryonic tissues. Q-PCR values for each gene were normalized to expression levels of rpl7 using the 2-DDCT method [71]. Expression in adult eye (fish) (Fig. 5) or heart (chicken) was set as a reference (value: 1). Data are presented as mean ± standard deviation of two independent quantitative real-time PCR experiments (average of two independent reverse transcription reactions, each tested with two PCR reactions). Black bars represent male tissues and organs, white bars female tissues and organs. For grey bars, the sex of the donor(s) is undetermined (embryos prior to sexual differentiation) or both sexes have been mixed (frog samples). H heart, I intestine, K kidneys, Li liver, M muscle, O ovary, T testis. Embryonic stages are referred to as [53] for medaka and [54] for zebrafish, respectively.