Fig. 6
Fig. 6
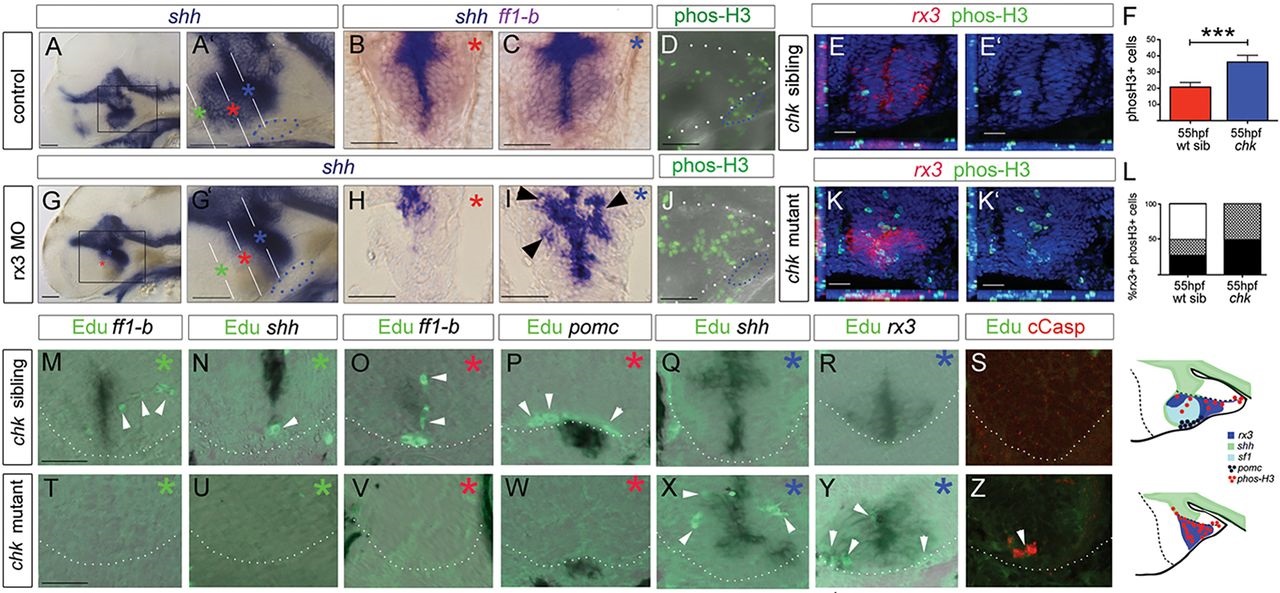
Rx3 promotes progenitor survival and growth. (A-C,G-I) Whole-mount side views (A,G) or sections (B,C,H,I: planes and positions indicated by coloured asterisks) through 55hpf control or rx3 morphant embryos. A′,G′ show high-power views of boxed regions in A,G. Arrowheads in I show disorganized shh+ cells around 3V. (D,J) Whole-mount side views of phosH3 in 55hpf control or rx3 morphant embryo. (E,E′,K,K′) Representative sections after phosH3/rx3 co-labelling in 55hpf chk sibling or mutant embryos. E′,K′ show single-channel views. (F,L) Quantitative analyses. (F) Numbers of phosH3+ cells in chk mutant or sibling embryos (n=6 each). Significantly more phosH3+ cells are detected in mutants compared with siblings (P<0.001). (L) Proportion of phosH3+ cells that are rx3+ (black), adjacent to (hatched) or distant from (white) rx3+ cells in mutant versus sibling chk embryos. (M-R,T-Y) Representative serial sections, from rostral to caudal (coloured asterisks denote approximate position of each section, see A′,G′) of a 55hpf chk sibling (M-R) or mutant (T-Y) embryo. White arrowheads point to EdU+ cells. (S,Z) Representative sections of 35hpf chk sibling or mutant embryos. 18±2 cCasp+ cells detected in chk mutants, n=8 embryos. Schematics summarize expression patterns in mutant versus sibling chk embryos. White and blue dotted lines as in Fig. 2. Scale bars: 50µm.

