
Fig. 1
- ID
- ZDB-IMAGE-160727-37
- Genes
- Publication
- Maulding et al., 2014 - Mesodermal Fgf10b cooperates with other Fgfs during induction of otic and epibranchial placodes in zebrafish
- All Figures
- Figures for Maulding et al., 2014
|
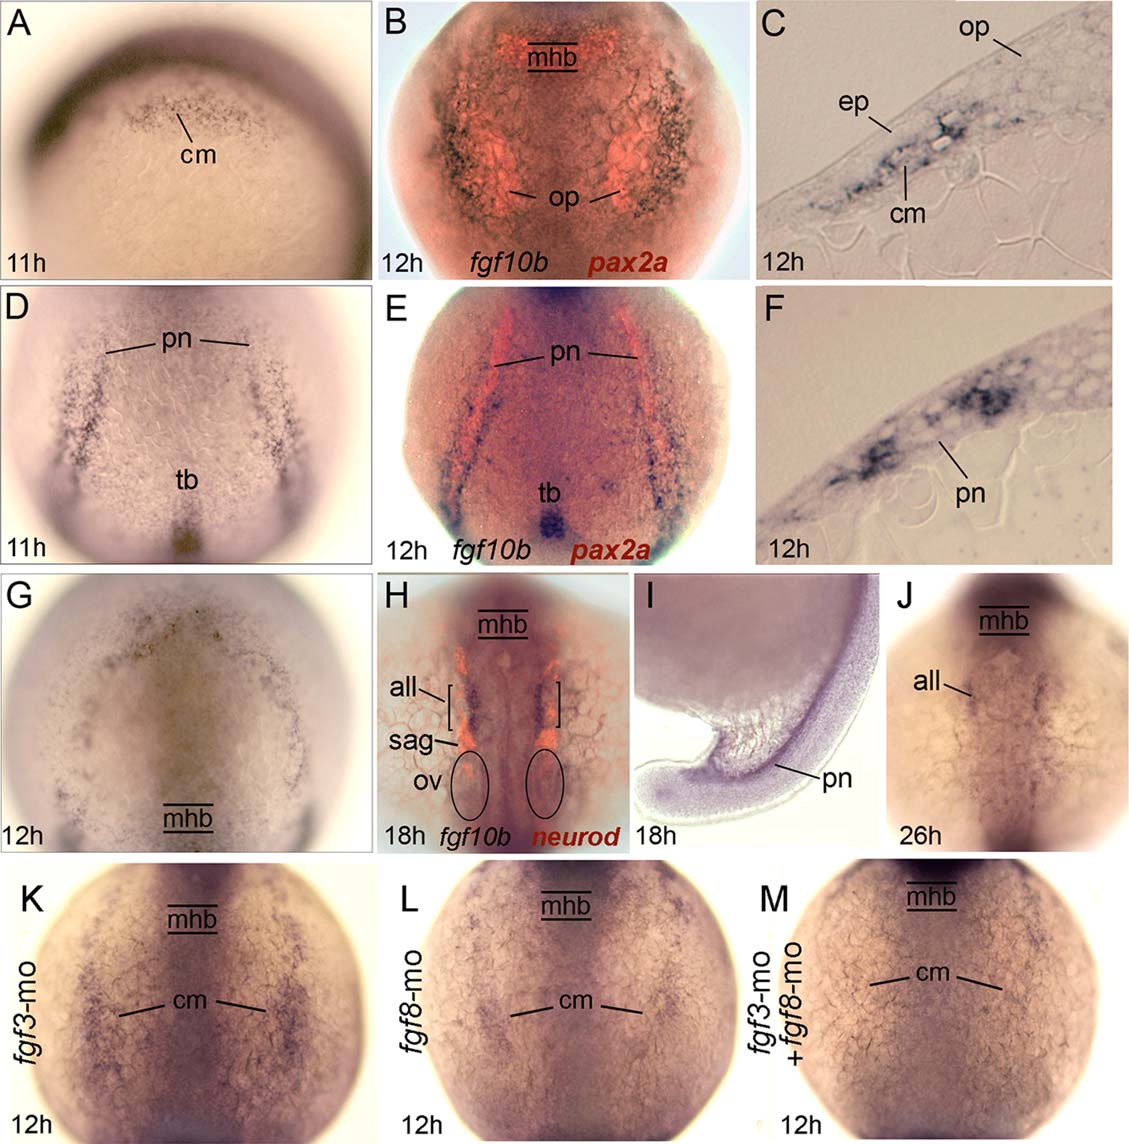
Fig. 1
Expression and regulation of fgf10b. A-G: Early expression of fgf10b marks mesoderm near the otic/epibranchial domain (A-C), flaking the pronephros (D-F), and surrounding the anterior neural plate (G). Specimens in (B) and (E) also show pax2a expression (red) in the otic placode and pronephros, while (C) and (F) show fgf10b expression in cross-sections. H-J: Late expression in the anterior lateral line and pronephros. The specimen in (H) also shows neurod expression (red) to reveal neurogenesis in various placodal derivatives. K-M: Expression of fgf10b in cranial mesoderm appears normal in fgf3 morphants (K) but is reduced in fgf8 morphants (L) and nearly abolished in fgf3-fgf8 double morphants (M). all, anterior lateral line; cm, cranial mesoderm; ep, epibranchial placode; mhb, midbrain-hindbrain border; op, otic placode; ov, otic vesicle; pn, pronephros; sag, statoacoustic ganglion; tb, tailbud. Whole-mount specimens are shown with dorsal views (anterior to the top) except for (A,I), which are lateral views with dorsal to the right. Cross-sections are shown with dorsal to the top.