Fig. 4
Fig. 4
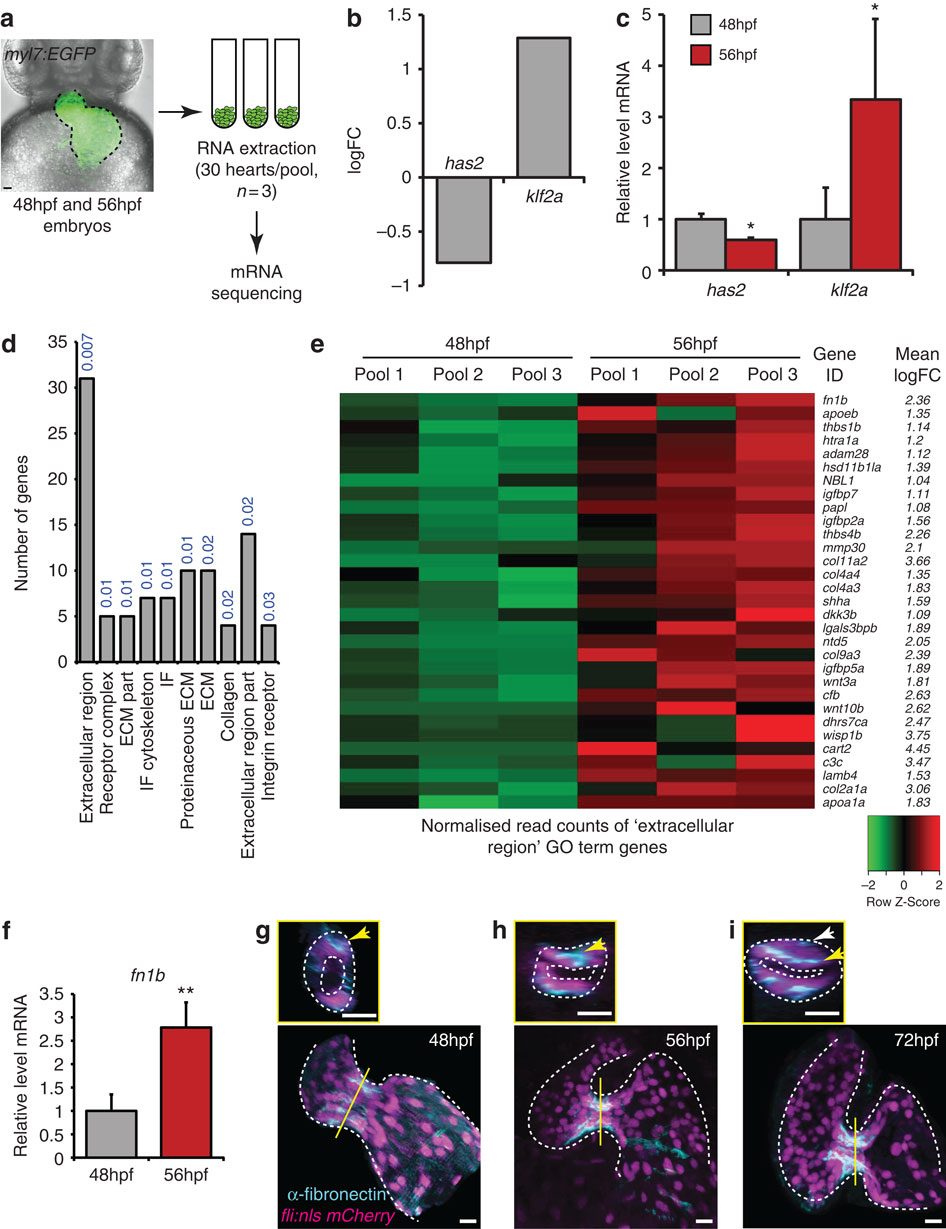
Transcriptome analysis identifies increased ECM protein gene expression during initial stages of valve formation.
(a) Experimental set-up for mRNA sequencing. RNA was extracted from hearts of myl7:EGFP embryos dissected at 48 and 56 hpf, in pools of 30 (n=3). (b) Downregulation of has2 and upregulation of klf2a transcripts, confirmed by qPCR (c), validated our approach. (d) Gene Ontology (GO) analysis based on cellular compartment terms of upregulated genes highlighted a significant enrichment of ECM-related terms. P values describing the significance of each term enrichment are shown in blue. (e) Specific analysis of the most significantly enriched group (the ‘extracellular region’ term), highlighting, among others, elevated fibronectin1b expression between 48 and 56 hpf. (f) qPCR analysis of heart RNA confirms an increase in fn1b transcript levels between 48 and 56 hpf. (g-i) Immunofluorescence analysis shows fibronectin synthesis is localized to the AVC during early stages of valve formation (n=8 (48 hpf), n=11 (56 hpf) and n=7 (72 hpf)). Yellow lines mark the position of the transverse sections shown in small panels. Yellow arrows highlight enriched fibronectin-positive staining in the superior AVC. White arrow in small panel (i) points to fibronectin deposition on multiple cell layers. Student’s t-test ***P<0.005, **P<0.01, *P<0.05. Scale bars, 10 µm.

