
IMAGE
Fig. 3
- ID
- ZDB-IMAGE-160208-7
- Genes
- Publication
- Yelin-Bekerman et al., 2015 - Hypocretin neuron-specific transcriptome profiling identifies the sleep modulator Kcnh4a
- All Figures
- Figures for Yelin-Bekerman et al., 2015
Image
|
Figure Caption
Fig. 3
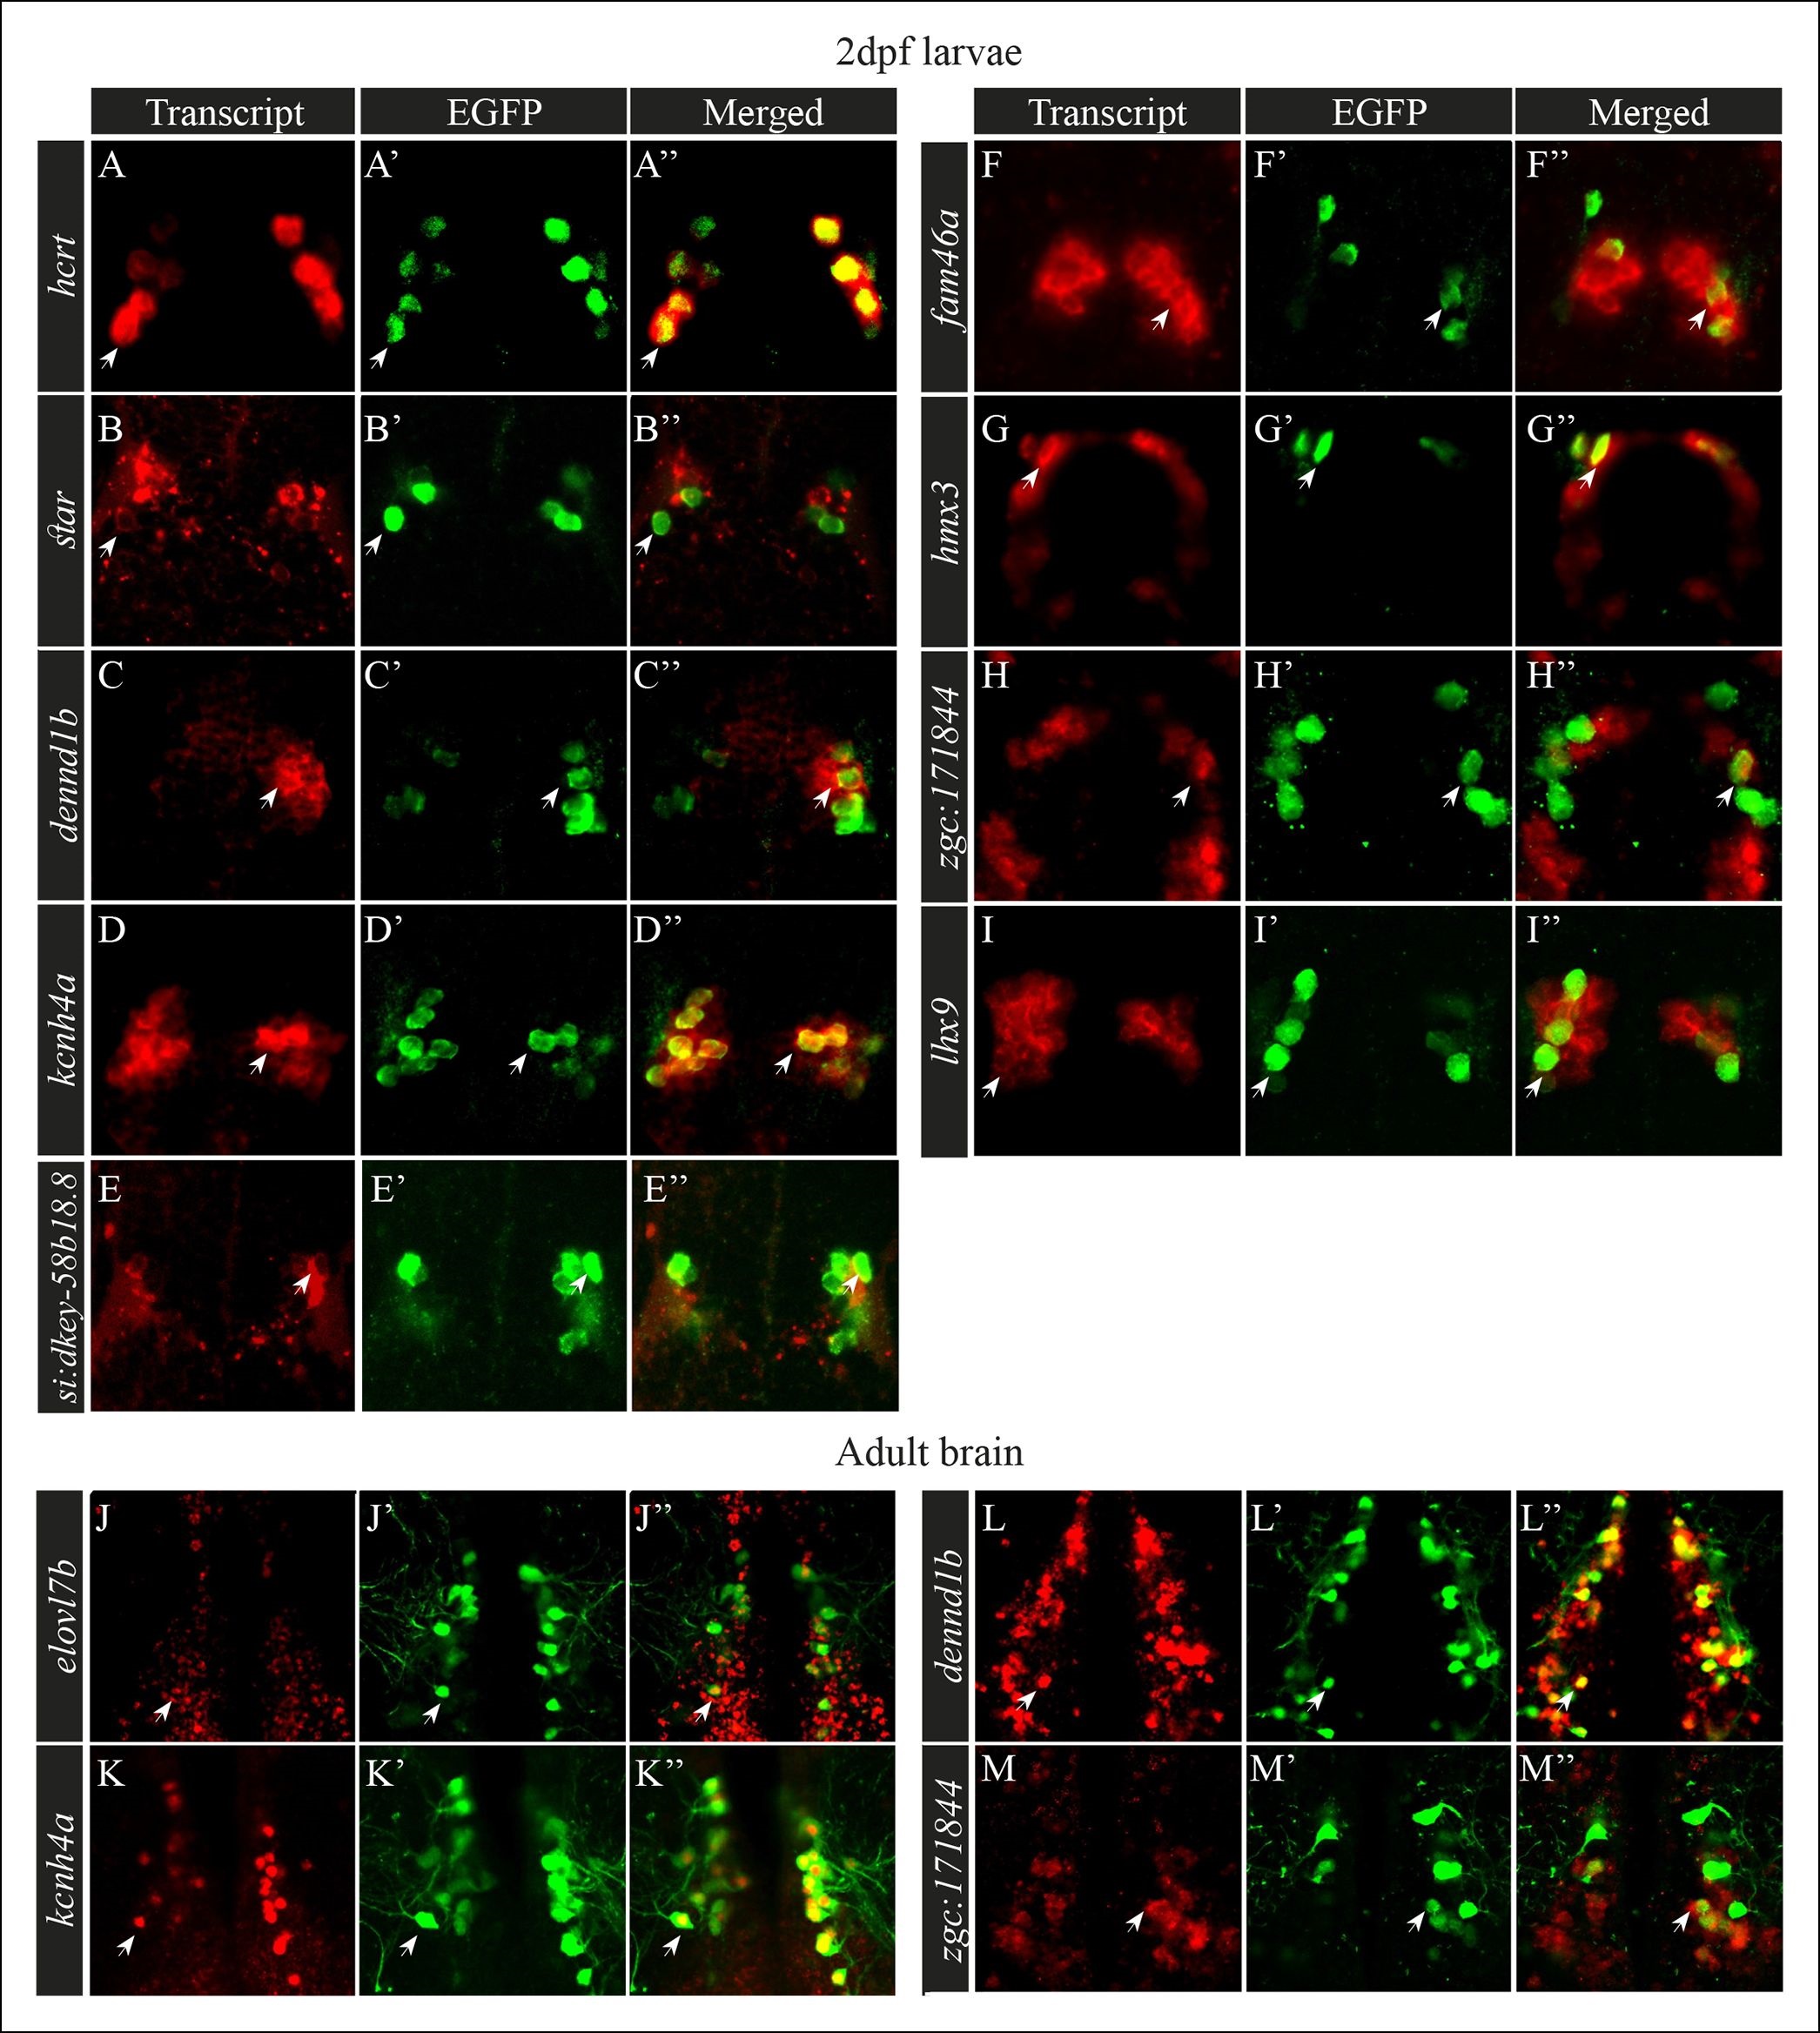
Selected candidate genes are expressed in Hcrt neurons.
(A–I′′) Double fluorescent staining of the candidate genes (red) and EGFP (green) was performed in 2 dpf hcrt:EGFP larvae using whole-mount ISH and immunofluorescence, respectively. White arrows indicate representative co-expressing cells. All confocal images show single plane view of 0.5 µM width. (J–M′′) Double fluorescent ISH and immunofluorescence experiments in brain sections of hcrt:EGFP adult zebrafish. Co-localization of candidate genes (red) and EGFP (green) in Hcrt neurons is shown. All images show single plane view of 0.5 µM width.
Figure Data
Acknowledgments
This image is the copyrighted work of the attributed author or publisher, and
ZFIN has permission only to display this image to its users.
Additional permissions should be obtained from the applicable author or publisher of the image.
Full text @ Elife