
Fig. 3
- ID
- ZDB-IMAGE-151214-53
- Genes
- Publication
- Takeuchi et al., 2015 - LSD1/KDM1A promotes hematopoietic commitment of hemangioblasts through downregulation of Etv2
- All Figures
- Figures for Takeuchi et al., 2015
|
Fig. 3
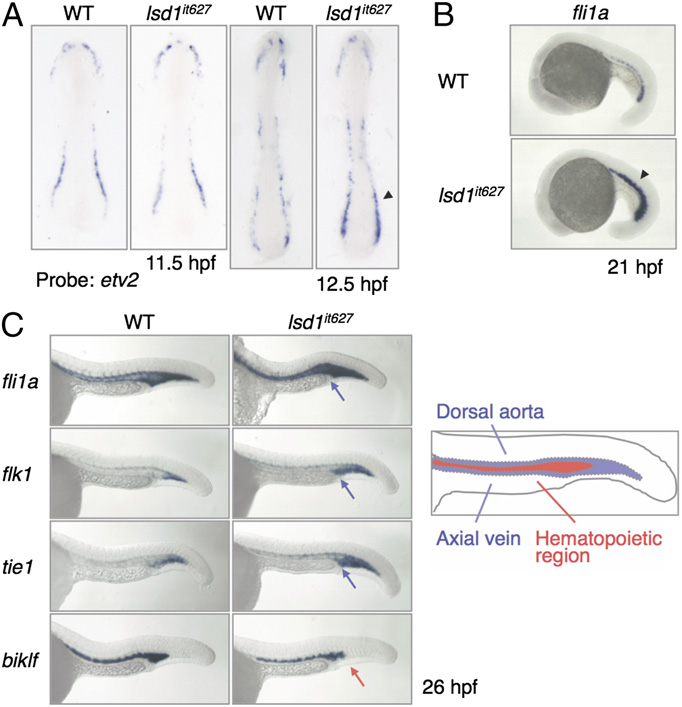
Up-regulation of endothelial markers in lsd1it627 embryos. (A) Expression of etv2 at the indicated developmental stages in WT or lsd1it627 embryos. The arrowhead indicates the up-regulation of etv2 in the posterior LPM. (B) Expression of fli1a at 21 hpf in WT or lsd1it627 embryos. The arrowhead indicates the up-regulation of fli1a in the ICM. (C) Expression of fli1a, flk1, tie1, and biklf at 26 hpf in the trunk region. The blue and red arrows indicate up-regulation of endothelial markers and down-regulation of a hematopoietic marker, respectively, in the hematopoietic region. (Right) Diagram of the hematopoietic and endothelial regions in WT embryos.