
|
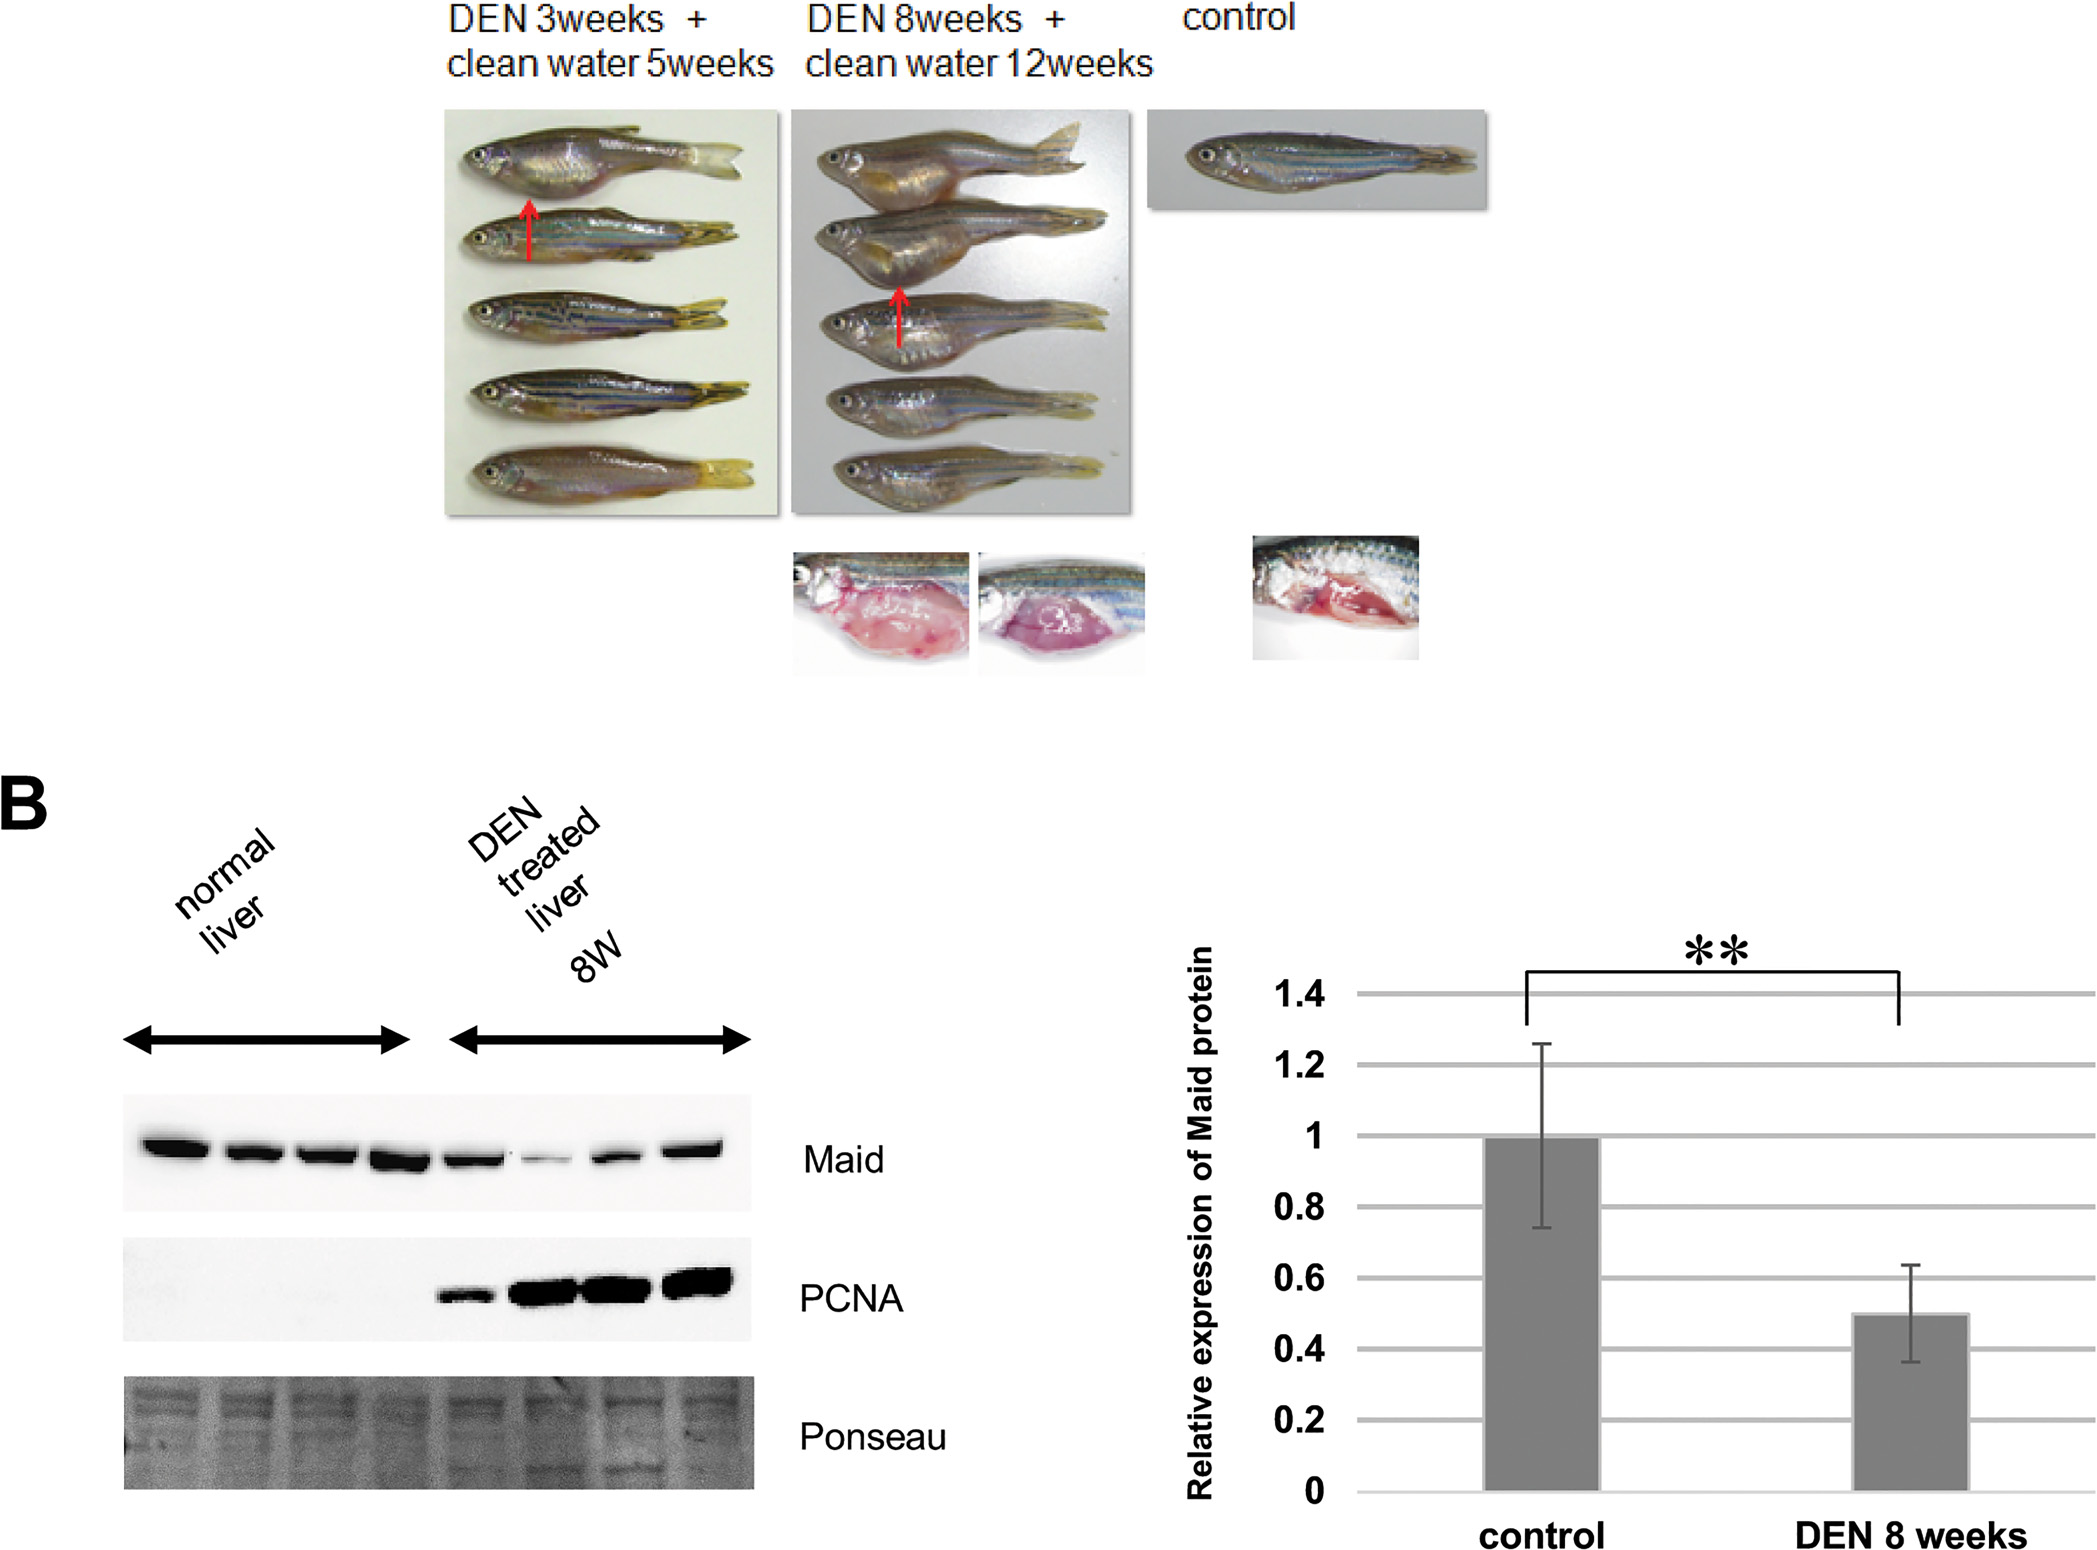
Fig. 4 Liver expansion and reduced Maid expression during chemical carcinogenesis in zebrafish.
(A) Top left: Macroscopic views of zebrafish in Group 1. Red arrow indicates a distended abdomen. Top middle: Macroscopic views of zebrafish in Group 2. Top right: Macroscopic view of a control zebrafish reared for 5 weeks in clean water and not exposed to DEN. Bottom panels show macroscopic views of (middle) livers of two DEN-treated zebrafish in Group 2 and (right) healthy control liver. (B) Western blot analysis of Maid and PCNA protein in two normal zebrafish livers and livers of 5 zebrafish subjected to 8 weeks of DEN administration. Left: Graphical representation of Western blot analysis, **, p<0.01.