
IMAGE
Fig. 4
- ID
- ZDB-IMAGE-150805-4
- Genes
- Publication
- Koch et al., 2014 - A Mutation in cnot8, Component of the Ccr4-Not Complex Regulating Transcript Stability, Affects Expression Levels of Developmental Regulators and Reveals a Role of Fgf3 in Development of Caudal Hypothalamic Dopaminergic Neurons
- All Figures
- Figures for Koch et al., 2014
Image
|
Figure Caption
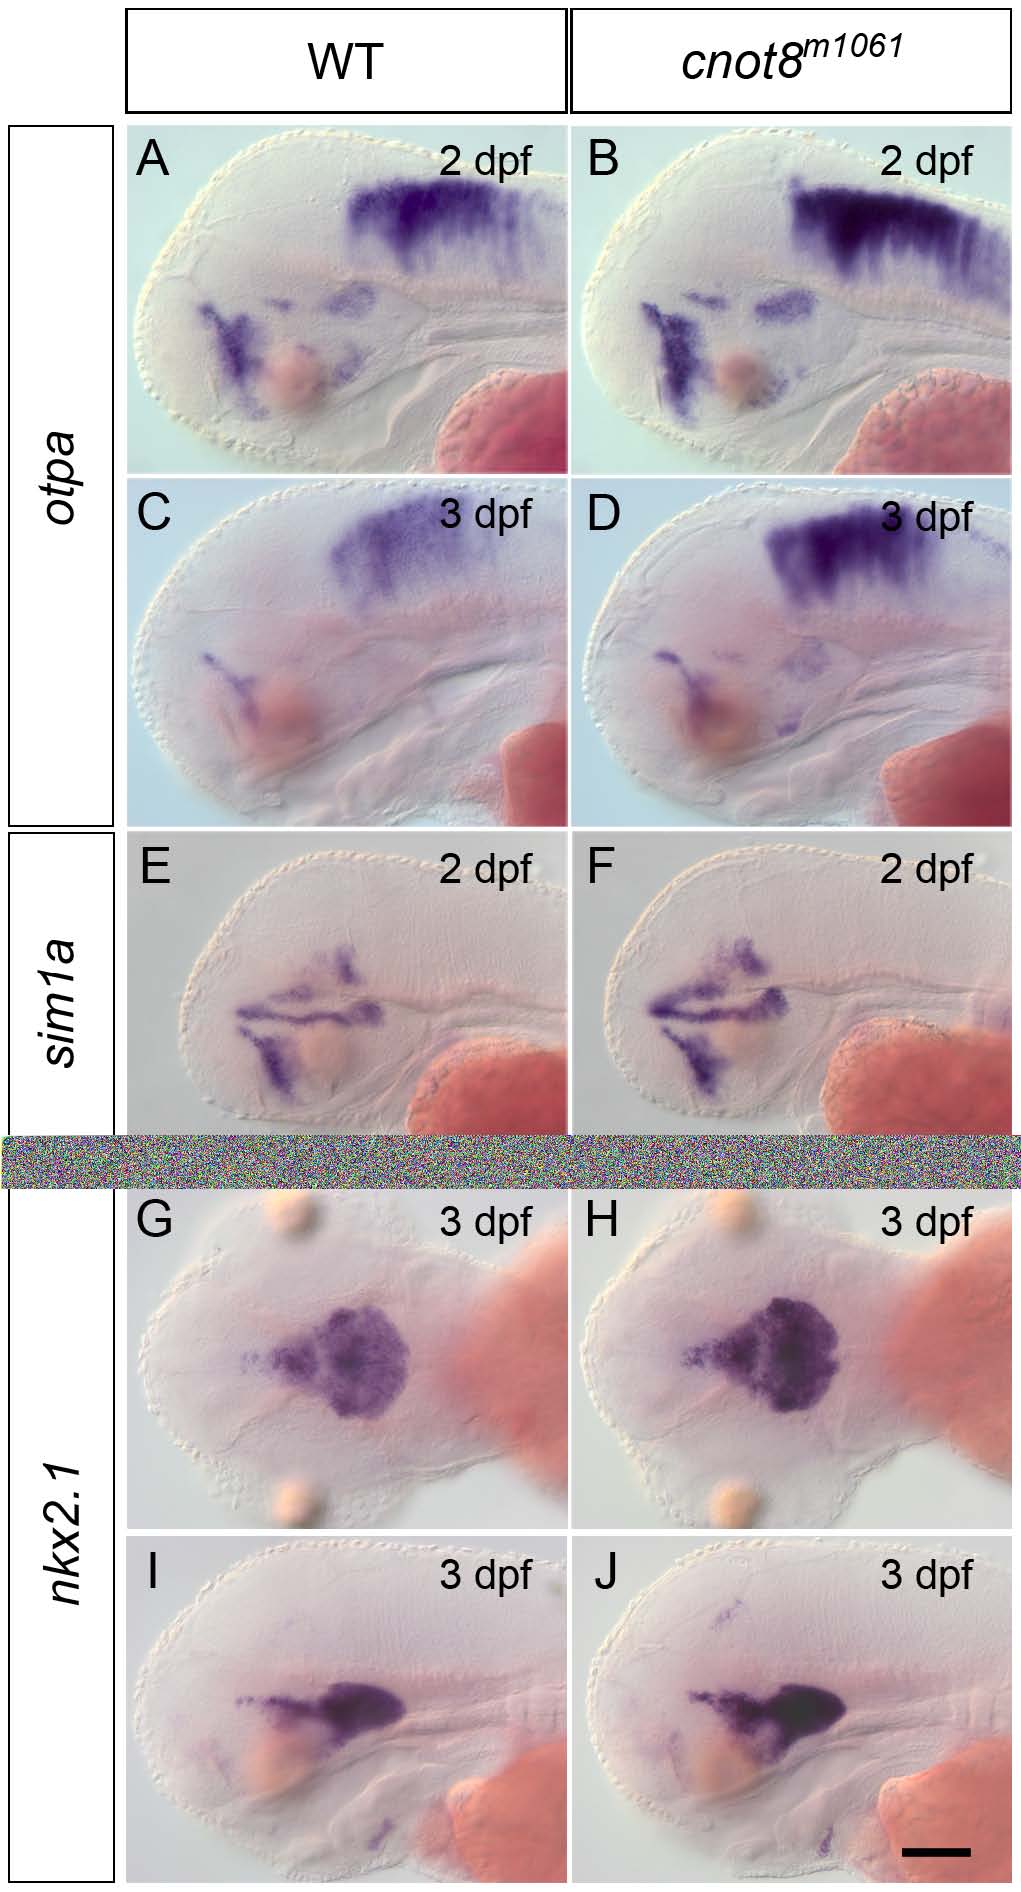
Fig. 4 sim1a, otpa and nkx2.1a expression in cnot8m1061 embryos and WT siblings.
Analysis of otpa (A–D), sim1a (E, F) and nkx2.1a (G–J) gene expression in cnot8m1061 mutant embryos and wild-type siblings, stages as indicated. (A–F, I, J) lateral views. (G, H) dorsal views. Embryos were genotyped by PCR. Scale bar 100 µm.
Figure Data
Acknowledgments
This image is the copyrighted work of the attributed author or publisher, and
ZFIN has permission only to display this image to its users.
Additional permissions should be obtained from the applicable author or publisher of the image.
Full text @ PLoS One