
Fig. 8
- ID
- ZDB-IMAGE-150602-30
- Genes
- Publication
- Liu et al., 2015 - Differential expression of protocadherin-19, protocadherin-17, and cadherin-6 in adult zebrafish brain
- All Figures
- Figures for Liu et al., 2015
|
Fig. 8
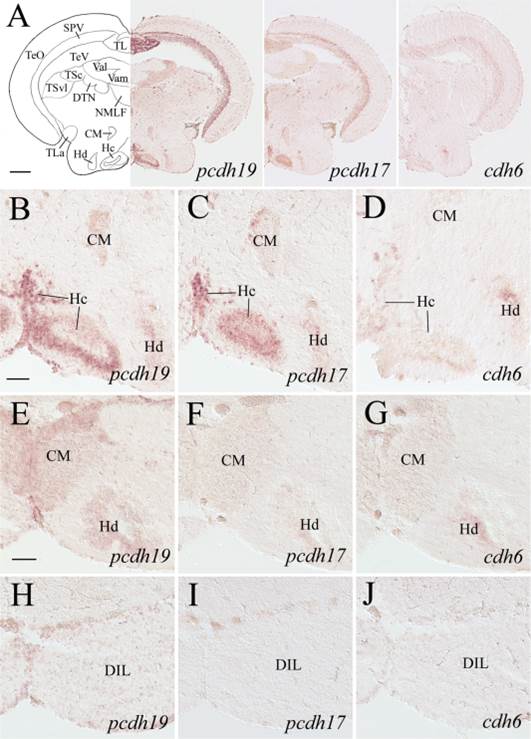
pcdh19, pcdh17, and cdh6 expression in the optic tectum, posterior tuberculum and hypothalamus. Top panels show low magnifications of sections from a level indicated in Fig. 1. The section processed for cdh6 in situ hybridization was from a different fish showing similar hypothalamic areas. B–D: Higher magnifications of the ventral posterior tuberculum and medial hypothalamus from their respective images in the top panels. E–J: Higher magnifications of similar regions from sections posterior to those shown in the top panels: E–G are 100–150 µm posterior to B–D, while H–J are 100–150 µm posterior to E–G. See list for abbreviations. Scale bar = 200 µm for the top panels, 50 µm for the remaining panels (B–J have the same magnification).