
Fig. 6
- ID
- ZDB-IMAGE-150430-50
- Genes
- Publication
- Lush et al., 2014 - ErbB expressing Schwann cells control lateral line progenitor cells via non-cell-autonomous regulation of Wnt/beta-catenin
- All Figures
- Figures for Lush et al., 2014
|
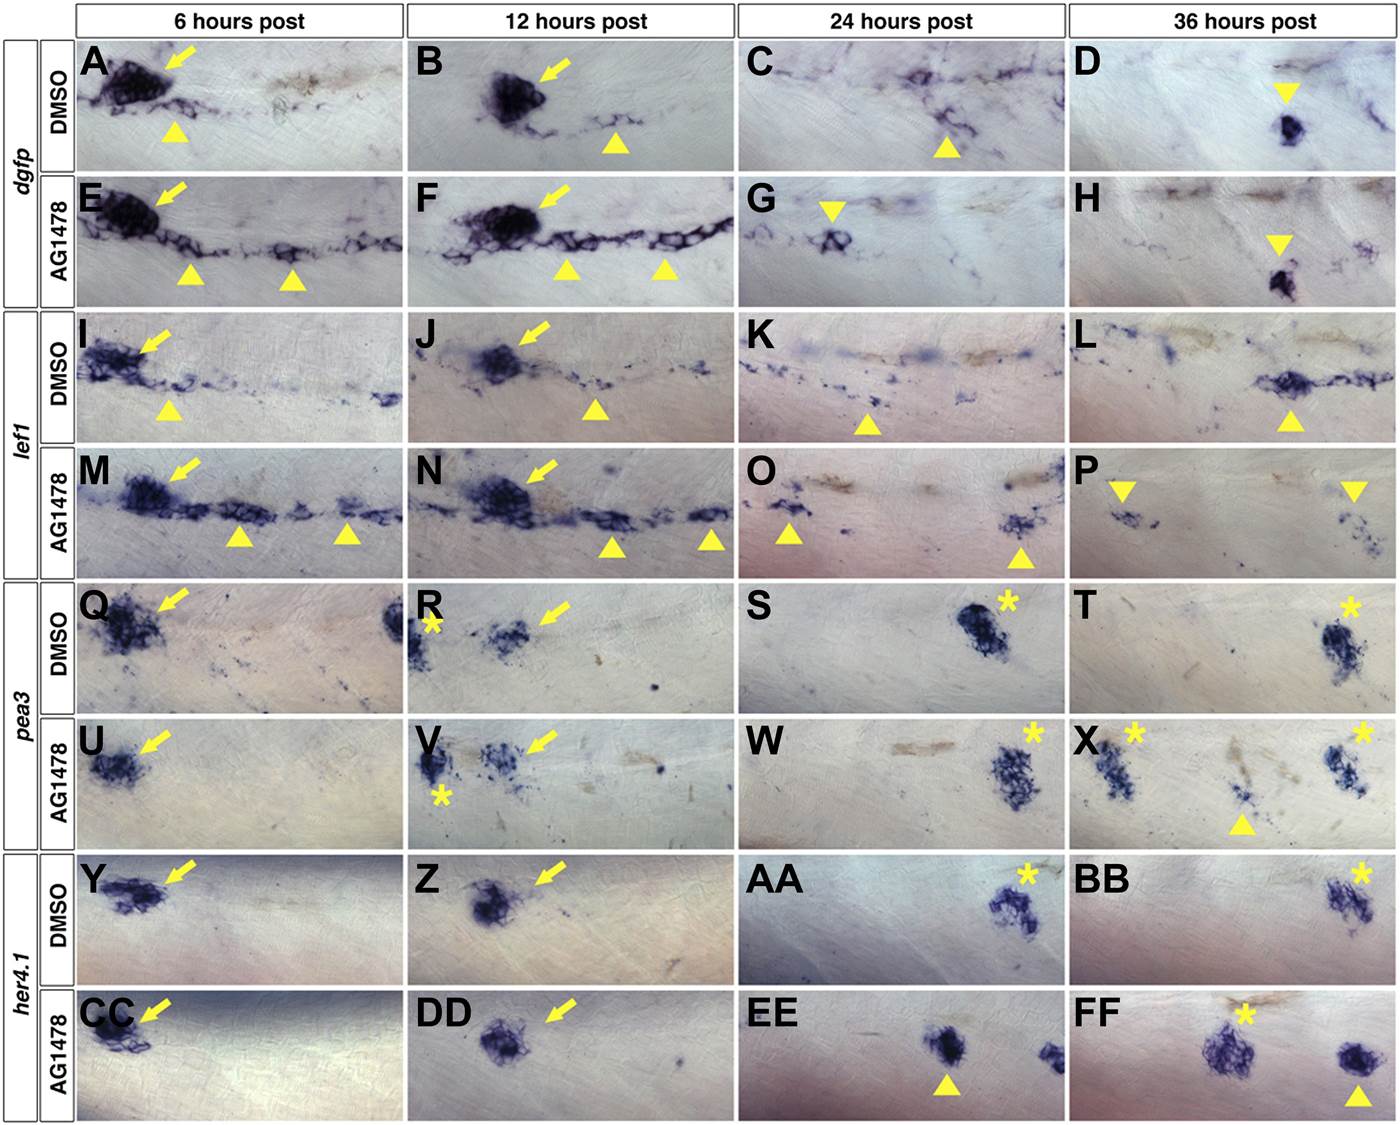
Fig. 6
Wnt/β-catenin expression precedes Fgf and Notch expression after ErbB inhibition.
To determine which signaling pathways are induced first we treated wild type zebrafish starting at 48 hpf with DMSO or AG1478 then fixed at 6, 12, 24 and 36 hr post treatment. All images were taken between the first two primary neuromasts. In DMSO treated Wnt reporter Tg(Tcf/Lef-miniP:dGFP) strong expression is seen in primII (arrow) at 6 and 12 hr post treatment but also in some interneuromast cells (A–B, arrowhead). By 12 and 36 hr there are only clumps of interneuromast cells expressing the reporter (C–D, arrowhead). 6 hr post AG1478 treatment there is a large increase in Wnt reporter expression specifically within interneuromast cells (E, arrowhead). This AG1478 induced increased expression is maintained after 12 hr (F) but has started to go down by 24 hr (G) and is only seen in a few interneuromast cells by 36 hr (H). (I–P) lef1 mirrors Wnt reporter expression. In DMSO, lef1 is expressed in primII (arrow) and few interneuromast cells at 6 (I) and 12 hr (J). At 24 hr post DMSO lef1 is maintained in a few interneuromast cells (K). At 36 hr post DMSO, lef1 is seen in clumps of cells likely corresponding to normally developing intercalary neuromasts (L, arrowhead). AG1478 induces lef1 within interneuromast cells at 6 (M) and 12 hr (N). By 24 (O) and 36 hr (P) post AG1478 treatment lef1 is decreased in interneuromast cells compared to the 6 and 12 hr time points, and is maintained in a few clumps of interneuromast cells (arrowhead). (Q–X) pea3 shows a later induction than Wnt target genes. In controls pea3 is only seen in primII (arrow) or primII deposited neuromasts (asterisk) at all time points tested (Q–T). (U–X) After AG1478 treatment, pea3 is maintained in deposited neuromasts (asterisk) and begins to be expressed in interneuromast cells only at 36 hr post treatment (X, arrowhead). (Y–FF) her4.1 expression is seen before pea3 expression. (Y–BB) In controls, her4.1 is seen in primII (arrow) and deposited neuromasts (asterisk). In AG1478 treated larvae her4.1 is seen in large clusters of cells starting at 24 hr post treatment and can still be seen at 36 hr (EE–FF, arrowhead).