
Fig. 5
|
Fig. 5
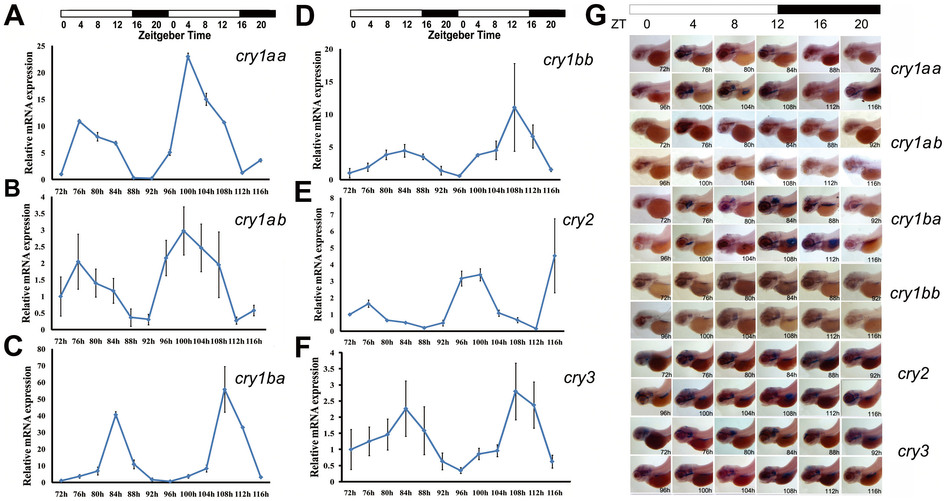
Diverse and rhythmic expression patterns of zebrafish cry genes.
(A) Rhythmic expression of zebrafish cry1aa determined by qRT-PCR. (B) Rhythmic expression of zebrafish cry1ab determined by qRT-PCR. (C) Rhythmic expression of zebrafish cry1ba determined by qRT-PCR. (D) Rhythmic expression of zebrafish cry1bb determined by qRT-PCR. (E) Rhythmic expression of zebrafish cry2 determined by qRT-PCR. (F) Rhythmic expression of zebrafish cry3 determined by qRT-PCR. Each value is the mean ± SD of the three independent experiments. (G) Lateral views (anterior to left) of expression patterns of zebrafish cry1aa, cry1ab, cry1ba, cry1bb, cry2 and cry3 shown by in situ hybridization. Whole-mount in situ hybridization was performed to examine expression patterns of six cry genes from 72hpf to 116hpf (Day 4 and Day 5 post fertilization, at 4h intervals each day). Black in the horizontal bars at the top represent darkness, and white bars indicate light. Zebrafish cry1aa, cry1ab, cry1ba, cry1bb, cry2 and cry3 display diverse patterns of rhythmic expression in larvae. cry1aa and cry1ab display distinct but similar rhythmic expression patterns, both reaching a trough at ZT15-19. The oscillating patterns of cry1ba and cry1bb are similar, both peaking at ZT13-15. The oscillating patterns of cry2 and cry3 differed from each other: cry2 peaked at ZT23-1, while cry3 peaked at ZT9. In situ hybridization results are consistent with those of qRT-PCR.